
I am so sick of this obvious lie
I am so sick of hearing the blatantly untrue mantra that Labour are the party of debt and deficits, and the Wolf of Wall Street party are more responsible with money.
You only have to look at the figures to realise this is a lie. But it’s a very successful lie, because apparently hardly anyone actually looks at the figures.
Frank Macskasy does, and has been powerfully refuting this bollocks from National MPs and leaders for years now.
And yesterday, Mickysavage from The Standard responded to the latest idiot millionaire (good at making money, not so good at fact-checking National spin) to whom the corporate media has given uncritical voice to trumpet this propaganda. He says it better than I can:
Rod Drury: “What I’d like to see is the Government have another term because they’ve had two terms where they got the debt sorted …”
Mickysavage: “Such economic illiteracy coming from such a senior businessman is a worry. It obviously needs to be repeated that in June 2008 Labour had paid off
allcrown debt and the crowns accounts showed a slight surplus. By September 2013 net Crown debt had reached $60 billion and increases in debt are predicted for years to come.
Of course many will then trot out Key’s mantra that Labour had left the country with a decade of deficits but this statement is essentially a lie. The Global Financial Crisis was the cause of the sudden change in the country’s finances but instead of Helen Clark and Michael Cullen being blamed I can suggest many other names of those who should take responsibility. Names such as Wall Street, Morgan Stanley, Bear Stern and my personal favourite Merryl Lynch. Because it was a bunch of robber merchant bankers that brought the world’s economy to its knees.”
~~~~~
UPDATE 30/08/2014:
Here’s a couple more graphs and a couple more quotes, to help illustrate the various impacts of the GFC (for which Key was partly responsible), the 2010 tax changes (which made tax regressive for the majority of incomes), and the Canterbury earthquakes.
However, please note that the main point of this blog was never to say National have been irresponsible with their deficits and debt (I tend to think they have been, but it’s a complicated question). The main point was to show that the right-wing suggestion that Labour are irresponsible with deficits and debt is completely unfounded.
“The estimated cost of the Canterbury rebuild has been increased … Mr Key said the budget would also show the estimated net cost of the earthquakes to the Crown would rise from about $13 billion to about $15 billion.”
“Tax as a proportion of GDP is slightly below OECD averages and has declined markedly over the last few years … New Zealand has, like other countries, faced a cyclical decline in tax revenue as a result of the global financial crisis but there were also important policy steps which reduced tax revenue between 2004–05 and 2009–10.”
P.S. 16/09/2014:
I’ve written a sequel blog on the equally pernicious lie that National are better for employment than Labour, because (it’s assumed) beating up beneficiaries and keeping wages low are good for unemployment.

In the interests of thoroughness, I should point out that debt has fallen slightly relative to GDP in the 2013 update to Frank Macskasy’s graph that I include above. Also, it wasn’t just the Clark government that paid off debt – the Bolger and Lange governments did too. This government actually represents a dramatic reversal of three decades of paying off debt since Muldoon. Figures from 1986 to 2013 are here: http://www.tradingeconomics.com/new-zealand/government-debt-to-gdp
It’s also worth noting of course that debt in dollar terms is still forecast to continue rising for years: http://www.stuff.co.nz/national/politics/9380846/Public-debt-climbs-by-27m-a-day
LikeLike
Kia ora, Caleb,
Whilst you make valid points, it doesn’t detract from the central argument that National and it’s supporters have been spinning the lie that the 2000-08 Labour government was a government of debt. It clearly was not. It paid down debt; increased funding for public services; and still posted nine consecutive surpluses.
I believe that’s the central issue here. The Right does not want Labour’s track record to stand, otherwise their own fiscal track record will be held up in comparison.
LikeLike
I agree – that’s why I didn’t put these provisos in the main text of the blog. They’re not the main point, nor do they cancel it out.
Indeed they certainly don’t want their record held up to scrutiny (although if it is, they can always blame global financial crises and earthquakes for their choices).
LikeLike
It is also Relevant to point out that Muldoon Spent it ALL and put Us in the SHIT Before Lange came to Office … 🙂
LikeLike
Very true.
LikeLike
Muldoon was put out of office 30 years ago. Surely there must be a statute of limitations on blaming Muldoon for everything!
LikeLike
Also very true.
LikeLike
Somebody commented on Facebook to the effect that I don’t mention the major events that have happened in the world and NZ since 2008 that could contribute to burgeoning debt.
To which I respond…
National have a two-part strategy:
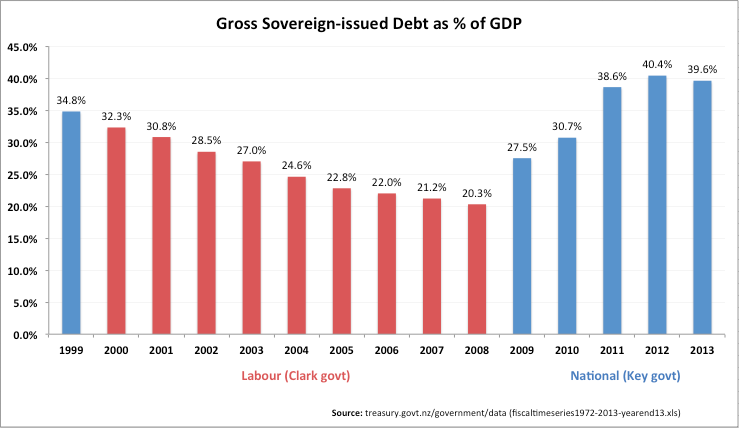
(a) pretend Labour were bad with debt and money, and would be again, but now the economically responsible National are sorting it out. (But of course this is only true if your definition of ‘responsible with money’ is adhering rigidly to neo-liberal ideology… it’s not empirically demonstrable at all … as the graph shows, empirical data suggests the reverse.)
(b) when someone points out this empirical data, blame the recession and earthquakes in order to obscure their own choices like lowering taxes for the rich and effectively raising them for the poor. (The irony of course is that the policies they stand for – not to mention John Key as an individual – actually helped cause the recession.)
This latest blog is written in response to strategy (a), but my very first blog actually responded to strategy (b): https://cutyourhair.wordpress.com/2012/06/15/austerity-says-we-all-need-to-tighten-our-belts-national-says-the-poor-and-the-public-have-to-tighten-their-belts-but-the-rich-can-loosen-theirs/
LikeLike
I’d say that’s a fair evaluation, Caleb. As you rightly point out, National didn’tcause the GFC or earthquakes (though the National Party is part and parcel of the neo-liberal paradigm), so the recessionary effects were beyond their control.
What irks me – and you’ve touched nicely on it;
1. Exploiting the situation to castigate Labour. If it hadn’t been for Cullen, New Zealand would not have been at a low debt-level from which to weather the economic storms,
2. Cutting taxes when we could ill afford to (2009 and 2010). English and Key promised not to borrow for tax cuts and to “ring fence” the cuts/borrowings. Which of course was outright garbage.
But New Zealanders bought into in and elected Key on his promises…
We got the tax cuts – funded from other people’s savings.,
And still the Nats have a reputation for “fiscal prudence”?! Gawd help me, I’m in The Twilight Zone…
LikeLike
Yip. That’s the central point, and it stands regardless of whether National MPs and supporters baldly lie (strategy a) or make excuses (strategy b): Regardless of GFCs or EQs, the last Labour government were far, far more financially responsible than the current National government.
LikeLike
Also the Christchurch Reinsurance Fund is one of the Greatest Fiscal Stimulus ANY country has seen since the GFC , so when anyone tells Me that gNational have achieved a “Budget Surplus” and Our Economy is the Envy of other Countries I kindly remind them that their Economy is Built of the Misery and Death and Suffering of an Earthquake … 🙂
LikeLike
Someone else has said the above graph is “just as bad as National’s” use of stats, because the x axis doesn’t start at zero and is therefore misleading.
Here’s my response…
It is misleading, yip – but you can blame tradingeconomics.com (the original source) for that – that’s what their graph automatically defaults to ( http://www.tradingeconomics.com/new-zealand/government-debt-to-gdp ). Not sure why – maybe they always do that to show contrast most strongly, or maybe they figure with a statistic like this it will never really be below 15% because governments always have some debt. It’s pretty standard practice not to start at zero in this kind of situation… but then it’s also a pretty standard (and valid) criticism that it’s misleading.
Personally I would have preferred it to start at 0. Interesting, the full 1986-2013 graph does start at zero.
A misleading x axis is certainly not “as bad” as National’s doublespeak … one exaggerates the true situation, the other one says the opposite of what’s true.
LikeLike
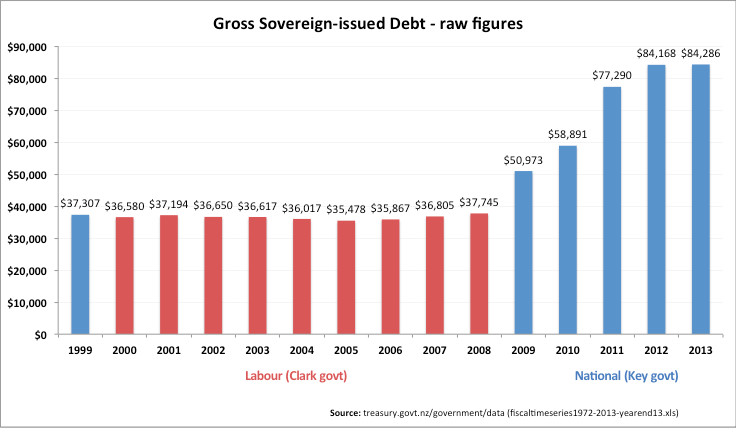
Please note that I have now made three of my own graphs to replace the problematic and out-of-date original one (I should have done this back in February!)
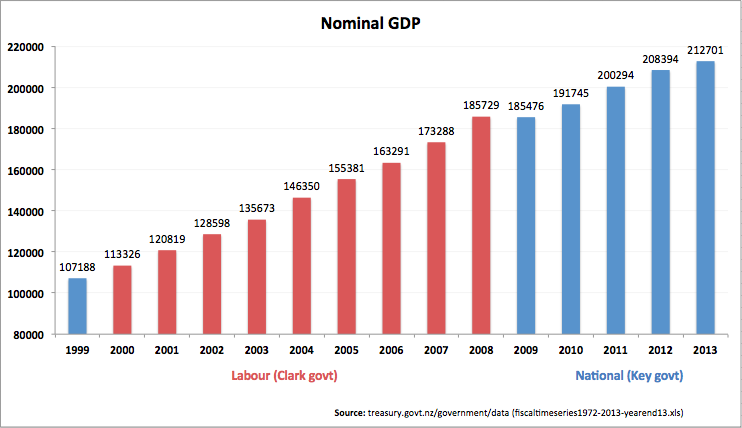
I haven’t truncated the Y-axis for either of the two debt graphs. I have truncated it for the GDP graph, but only because without truncating it, it was very difficult to see any effect of the GFC. (I.e. I did it to be fair to National, not my own side…)
LikeLike
If National manages to get debt down, I wonder if the critics will still be concerned about the “x axis starting at zero”? Hmmmm, I wonder…
By the way, this is the official Treasury graph, showing the same info: http://www.treasury.govt.nz/budget/2010/bps/04.htm/bps10-03.gif
It also doesn’t start at zero. It seems to work fine for them and I can’t recall critics complaining… 😉
LikeLike
Thanks Frank, love your work.
LikeLike
Cheers, mate. I’ve put your blog on my Blogroll – keep you work coming!
LikeLike
Frank, Caleb. For the record, the x-axis is the horizontal axis. It is the vertical y-axis that starts at 15%. And any claims that that is misleading is merely a red herring when the value of each vertical bar on the graph is stated just above it. Truncating the base of the plot at 15% is just a graphical convenience that allows a slight stretching of the y-axis without consuming more height, so as to accentuate year on year trends.
LikeLike
True re: x/y. Woops. How’d I miss that?
And – I agree. In any case, even if the y axis did start at zero, the picture wouldn’t look much different – 33.4 to 17.4 to 37 is still significant.
LikeLike
FYI, I have now made three of my own graphs to replace the problematic and out-of-date original one (I should have done this back in February!)
I haven’t truncated the Y-axis for either of the two debt graphs due to popular demand (you’re in the minority of commenters I’m afraid, and I want to make myself immune to criticism even though I can sympathise with both sides).
I have truncated it for the GDP graph, as the kind of “graphical convenience” you describe. Without truncating it, it was very difficult to see any effect of the GFC. (I.e. I did it to be fair to National, not my own side…)
LikeLike
Here’s a worrying comment about the possible consequences of the current govt’s reliance on debt: http://rebuildingchristchurch.wordpress.com/2014/02/18/the-celtic-tigers-new-zealand-oe/trackback/
LikeLike
Thanks for that – noted (And bookmarked). Yep, I’ve noticed our strange similarity with the “Celtic Tiger” thing. And as we recall, that did not end well either…
LikeLike
Any observation on timing of asset sell offs. If coincides with debt reduction it is also an issue as it creates a one off effect
LikeLike
Agreed. One of National’s big campaign lines at the moment is “we’re getting back into surplus and going to start paying off debt” … Well, they’ve projected a wafer-thin surplus based on fudged numbers and abandoning Christchurch, and it’s already looking like it might not happen, and how much does paying off debt depend on the selling of assets which earn more than debt costs in interest?
LikeLike
Your graphs are misleading
I agree with your basic argument but y axis needs to start at zero
LikeLike
Sorry I see there are comments here already on this
LikeLike
Yeah. Basically I largely (but not entirely) agree with you about tradingeconomics.com’s graph (but you probably figured that out from reading the other comments)
LikeLike
Please note that I have now made three of my own graphs to replace the problematic and out-of-date original one (I should have done this back in February!)
I haven’t truncated the Y-axis for either of the two debt graphs. I have truncated it for the GDP graph, but only because without truncating it, it was very difficult to see any effect of the GFC. (I.e. I did it to be fair to National, not my own side…)
LikeLike
I don’t allow ideological rhetoric to ‘crowd-out’ the facts (ref. Government Statistician ie Statistics NZ, or OECD benchmark comparisons) either. Facts are as stated; also per Fiscal Responsibility Act, 1992 – all Administrations have been bound to Balance the Government Accounts over the trade cycle. Hon Michael Cullen did that by close of year 2007, because NZ had the longest expansion phase ever 1993-2007 = almost 15 years.
responsibbillionso
LikeLike
Correct me if i am wrong, i don’t know much about economics…. If i was an individual with an income of 100,000 and a debt of 140,000 people would consider that a relatively or actually very low level of debt given my income. Is GDP actually relevant or is the governments tax take relevant? Tax take is around 50bn and debt around 70bn. Is this not a relatively low level of debt and not much to worry about given the financial times that have created it?
LikeLike
That’s party true – we have lower debt than many countries and it’s sensible to increase debt in tough financial times and pay it down in healthier times. But debt is still risky and costly and we should err on the side of too little debt, not too much. National’s record debt isn’t entirely created by the financial times; it’s also created by their decisions such as giving tax cuts to the rich and wasting billions on uneconomical motorways (see above on two-part strategy).
Anyway, the main problem this blog is highlighting is National’s hypocrisy in accusing Labour of increasing debt when in fact they’ve been the ones who’ve sent debt to record levels. A Labour government would probably also increase debt in tough financial times (not sure if it’d be more or less than National – they wouldn’t have given the tax cuts to the rich in a recession, but they also wouldn’t have sold assets or cut public services to the same degree as National) … but National try to paint Labour as financially irresponsible because of their willingness to accept debt in tough financial times, and themselves as more responsible because they were willing to sell assets to slightly reduce debt (even though the profit on the assets is more than the interest costs on the debt) and because more of them are rich white men in suits who are more stereotypically “money men.” This is of coure wrong on a great number of levels.
LikeLike
Also: the economy is now doing well, and they’re finally looking set to make their first surplus (though it’s wafer-thin, uncertain, and based on fudged numbers & abandoning Christchurch). So now is the time to start paying off debt (which they do thankfully say they’re going to do). But they’re also dangling a carrot of possible further tax cuts – presumably to the rich since most of what they do mostly benefits the rich. This is highly irresponsible given that they haven’t even started paying off debt yet, and our tax system is already very generous to the rich (phrase here, detail here). They should be paying off debt and restoring the public services they’ve cut (e.g. health, education, environment, tertiary education, student support, public schools, public spending generally) and actually doing something at last on child poverty, inequality, climate change and homes instead of ignoring, downplaying, “leaving to the market” or tinkering with Labour’s policies… not letting even more of the money that could do those things be swallowed up in more tax cuts for the rich.
Tax cuts for the rich (and tax increases for the poor via increased GST) were irresponsible in 2010, and they’d be irresponsible now. Tax cuts might be responsible in 5 years if we’d paid off a lot of the debt we’ve been building up lately, if they were targeted to the people who need tax cuts the most, and if a convincing case was mounted that they were affordable and necessary. Or sooner than five years if they were offset by smarter taxes on the rich’s unproductive and anti-social income, like a capital gains tax and/or financial transactions tax.
LikeLike
Rubbish! your left wing rhetoric hidden behind “facts” is ridiculous.
Labour didn’t pay down debt during it’s time and your graph clearly shows that! It remained relatively flat in a period where there were or at least should have been very significant surpluses which should have been used to pay down debt using your logic. This was the boom that NZ should have been saving more of so that we didn’t need to borrow as much during the GFC discounting the GFC as being so trivial as you seem to think it was, shows your lack of understanding of the issues around it. And to claim that John Key somehow partially caused it is completely naive, jealous and down right false. John Key was in essence a currency trader which had very little/anything to do with the GFC which was caused by financial engineering in debt markets.
I’m just hopefully that not too many people are naive enough to be taken in by your lies and manipulation of data that you so sanctimoniously claim National are guilty of.
LikeLike
Leaving it flat in raw terms when economic growth is so significant every year (even the recession is pretty much only reflected in GDP figures by GDP being flat one year) is effectively paying off debt. They could have done even better and paid it off in raw terms – that’s true. If they had managed to totally pay off all debt, National would have only skyrocketed it to less than $50 billion when GFC/earthquakes/their tax cuts came along, rather than $84 billion. $84 billion is still not that bad in the scheme of things, of course, and in fact much better than most countries (my point was never that $84 billion is too high).
LikeLike
,,,and dont forget that since 2008 unemployment has increased by about 50,000 but JK reckons he has made 50,000 new jobs…
LikeLike
Shsh! You’ll spoil my next blog!
LikeLike
So if the y axis started at zero (instead to making it look like Labour got the debt to almost nothing and then national multiplied it by ten!), and if we include (rather than exclude) the data showing a slow in the increase from 2012 to 2013 and then a reduction from 2013 to 2014, it would look like this:
Given the GFC from 2009 to 2011(ish), it’s not clear that this shows that National is more debt shy than Labour actually (i.e. what would Labour have done in the same years that the Nats have been in power?).
LikeLike
Hmmm, OK, so images are not allowed in comments. Here it is:

LikeLike
(lol, so a link becomes the image. I get it now.)
LikeLike
Thanks for that! That’s a better graph. If you give your permission, and a source for your figures, I’ll replace the above graph with your one. (This blog is actually half a year old now, and the graph more than a whole year. If I’d know this blog was suddenly going to go viral 7 months later I would have made my own more precise graph rather than just using someone else’s from the year before)
What would have Labour done? Well they would have had more tax revenue because they wouldn’t have given the tax cuts to the rich, and they would also have introduced a capital gains tax (well, they’re saying they’ll do it now, which I suppose doesn’t mean they would have actually done it if – especially since personnel are different). But on the other hand, they wouldn’t have cut public spending so much as National, and they wouldn’t have sold assets. On the whole, I’m not sure if they would have increased debt more or less than National.
However, the main point of the blog is not necessarily to say Labour would have done better with debt (we can’t know that for sure) but to point out the mistaken conception among National fans (encouraged by misleading statements from National MPs) than Labour are all about financial irresponsibility and debt, and National are all about financial responsibility and have (in the words of Drury) “got the debt sorted.”
I think you have National and Labour around the wrong way in your comment, btw.
LikeLike
Yes, my bad I switched Party names in the comment. I used your source: http://www.tradingeconomics.com/new-zealand/government-debt-to-gdp
By all means reproduce it if you like.
Also, you get a different picture if you take raw debt figures rather than debt as a % of GDP: http://www.tradingeconomics.com/new-zealand/external-debt
When you look at raw debt figures, the Labour bashing makes more sense. From 2002 to 2008 (Labour), total foreign debt increased steadily, but from 2008 it steadied and stopped increasing. A slight decrease from 2012 to 2014. So based on raw debt total, Labour racked up debt at a rate that National simply did not, and national has now made some very modest reductions on that debt, like so:

LikeLike
What all of the above tells us (and hence why the first, in isolation and with selected data excluded is potentially misleading) is exactly this: During the Labour governments reign, debt consistently increased, multiplying several times. When national came to power, and in spite of a GFC, that debt growth stopped in a very short space of time and is now in decline. However, due tot he GFC, our *GDP* decreased slightly during the years 2008-2012, and so debt as a percentage of GDP grew dramatically even though debt did not. But this too is now in decline.
So when we fill in some details that are surely relevant, the overall message of the blog post becomes essentially reversed. We can indeed blame Labour for the state of our debt, not national When National says that Labour is a part of debt unlike national, it is telling the truth.
LikeLike
That’s not quite right. The graph you show is total external debt (private and public). Here’s raw figures of government debt:
(From here)
Please note that the graph only goes until 2012 because the Reserve Bank have discontinued the document that was this graph’s source, but since then it’s risen further and is currently estimated at almost $86 billion on this admittedly-not-very-scientific live debt clock. So, yes, the raw data does show a different picture: Labour didn’t actually pay down debt in raw terms but let it fluctuate at around $15-20 billion. But National have let it skyrocket in raw terms, as well as as a percentage of GDP.
Lastly, please note that we also had mini-recessions (GDP declining) in about 2001 and 2007, but debt still stayed more or less the same (acutally dipped slightly at about the same times) which meant debt as a percentage of GDP still declined (cf original graph).
LikeLike
I put your graph up temporarily; thanks again. But I’ve made three of my own now (should have done this back in February!)
(Please note that I have in fact truncated the Y-axis for the GDP graph, but only because without truncating it, it was very difficult to see any effect of the GFC. I.e. I did it to be fair to National, not my own side…)
LikeLike
Whoops – quite right, it’s all external debt. My bad on that. That takes us in an interesting – but yes, quite different direction – about the indebtedness of the country as a whole and how that state changed under Labour and the Nats.
LikeLike
Judging financial responsibility by looking at debt levels isn’t exactly scientific. In fact it is like looking at the temperature to see whether it is sunny outside. Sure, if it is warm it is likely to be sunny, but that isn’t gospel.
If I took my personal situation, when I was 20 I had nearly no debt. But what I did spend my money on was booze and gadgets – I had a seriously nice stereo system in those days. Now I have about 6000% more debt, but I own 2 houses. By your analysis I am now much less financial responsible, something I doubt you will get my kids to agree to.
You claim to have looked behind the words at the actual figures – well I challenge you to judge financial responsibility by what the money was spent rather than debt. After all, if tax revenue was $100b under Labour, and they spent $95b while repaying debt with the rest, it is a more compelling argument for responsibility than saying tax revenue was $75b, spending was $95b and the difference was funded by borrowing.
LikeLike
You’re correct. This is one of the shortest and simplest blogs I’ve written. I intended it as a short and simple illustration of basically just one simple point (that Drury is wrong about the parties and debt) – I didn’t intend for it to be a thorough and multi-faceted argument for Labour being more financially responsible than National (for much more thorough analysis along those lines, see Frank Macskasy’s “Dollars and Sense” category of blogs).
Apparently the short and simple thing was effective, though, since this blog seems to be trending pretty strongly at the moment, and getting the most hits of any of my blogs by far. Alas… what you lose in thoroughness you gain in viewers, and vice versa.
Re: your challenge – I have a few other blogs in the works and other things in my life so I’m not sure if I’ll get around to doing that kind of analysis (also, these kind of stats are annoyingly complicated to track down online). Perhaps you could do it?
As I said above, we don’t know what Labour’s debt would have looked like compared to National’s under the same circumstances – and comparing the Clark government to the Key government is not really comparing apples with apples because of the decline in the health of the economy (which, by the way, people like Key caused).
What we do know is that the Fifth Labour govt:
– spent their five talents (to use the biblical metaphor) largely on the public and the middle-class (Working for Families, KiwiSaver, interest free student loans, expanding public services etc);
– ignored calls to cut income tax since we already had low income tax on a global scale; http://pundit.co.nz/content/low-tax-for-me-high-tax-for-thee
– ran surpluses every year;
– decreased debt and debt-relative-to-GDP every year;
– increased the minimum wage quickly.
And the fifth National govt:
– spent their two talents mostly on the rich (tax cuts for the rich, asset sales transferring public wealth and public profit into the hands of those rich enough to invest);
– increased tax for the poor (increasing GST, which means we now have regressive total tax up to $50,000 p.a. – well above the median income);
– made cuts for the public, poor and middle class;
– largely ignored a lot of the pressing issues facing NZ (climate change, child poverty, inequality, housing crisis); (to be fair, i’m not sure what the equivalent issues would have been in Labour’s term, and how well they tackled them)
– ran deficits (until possibly this year);
– increased debt and debt-relative-to-GDP until this year;
– and raised the minimum wage slowly.
Even when we acknowledge they’d both probably decrease debt in good times and increase it in bad (and it’s hard to say who would do better with that), we can still see some clear differences in their priorities (once again this is not a thorough and multi-faceted analysis).
LikeLike
Key objectives of a monetary reform prescription
“The key objectives of a monetary reform prescription are to enable a healthy producing economy that provides us all with sufficient income” said DSC Finance Spokesman John Pemberton. “It is not to provide massive profits for banks or to rob people of their life savings through collapsing Finance Companies and Share Markets.
“The producing economy is not the problem. It has, at times, clearly demonstrated that it can create the range, and quantity of goods and services people need and want. What is at fault is the mechanism we use to enable the wheels of production to turn – money and debt.
“The Monetary Reform Prescription:
• The Government to take back from financiers, on behalf of the public, our right to control the credit of the nation and to manage it as a public utility. The public utility will have the responsibility to introduce all new credit into existence.
• Money is to be regarded as a ticket to transfer the goods and services produced by the talents of our people, utilising the tools of science and technology, to the consumer – these tickets (money) should not be loaded with interest-bearing debt to a private financial institution.
• The gap or shortfall between the total value of our goods and services (GDP) and the total income available to spend on those goods and services needs to be filled without the burden of debt. This is to be done by treating the gap as a positive and monetising the appreciation of the nation’s increase in production value over incomes available. The best way to distribute this extra income should be investigated.
• The government shall spend sufficient credit into existence to revitalise the New Zealand economy by stimulating domestic industry, and funding infrastructure maintenance and development.
“The adoption of this prescription would give New Zealand the strongest economy on earth” Mr Pemberton concluded.
http://www.democrats.org.nz
PS thanks for this article, I am standing for Democrat for Social Credit in this years election and I am horrified at how National are playing with figures to suit themselves and blaming Labour for the ‘dreadful economy’ they inherited. Social Credit suggests a different way altogether…
LikeLike
Ahh yes. The old numbers without context routine. For a fulsome debate, we’d need to return to 1984. Granted, Muldoon did the country no economic favours. However, from the advent of Rogernomics policies of the same year we can see Gross debt roughly doubling under Labour (Lange, Palmer, Moore) from $21-$42 billion in a mere four years, when, look out, in rolls the protracted global recession of 1987. This lasts until about 1992. Unsurprisingly, debt rises sharply over this period as government takes corrective action to shore up an economy in freefall. The shambles is handed back to National (Bolger) in late 1990 (Bolger) who continue stimulus campaign aimed at maintaining demand and protecting jobs. Good for them. After peaking at around $45.5 billion in 1995 (there’s always an economic lag with such events), we see National reducing debt to $36.2 billion by 1997, when, bugger me, along comes the Asian Financial Crisis – a lesser crisis than 1987, but still requiring damage control, with an inflationary impact on gross debt. Debt peaks a year later at $38.5 billion, before pretty much flat-lining from 1999 to 2008 under a Labour government (Clark) – a sustained period of economic calm (but not growth). And now for the real kicker. Debt spikes from roughly $37.7 billion to $51 billion (approx. 45 percent increase) in 2009, the handover to National (Key). Oh, and at about exactly the same time as the start of the GFC. Now that’s how to exit government! And so off we go again, with National in damage control pretty much ever since. So let’s cut the ignorance and see these stats for what they are. Alone they are pretty much meaningless. The simplistic analysis presented in this blogger is a cynical attempt to distort the political debate. Shame on you.
LikeLike
Firstly you’re right about the figures.
Secondly, if you read the blog and especially the “Update” section, you’ll see the this blog is intended to CORRECT a distortion of the political debate embodied in Rod Drury’s comment. If he’d said National have managed the GFC well by sensibly increasing debt in tough financial times, that would be fine. But he says they’ve “sorted out the debt” which is completely wrong. This seems to be a very common misconception, and common misconceptions don’t just happen by accident; they happen largely due to impressions put across by National PR, and in some cases directly untrue statements by National MPs (see links to Frank Macskasy’s refutations), building the overall assumption that National are wise and responsible with money and Labour are wasteful and love debt. In fact, as you say, it’s far more complicated than that. The blog’s central thesis is that this is an obvious lie – and I stand by that central thesis.
I do not deny that there are very good reasons for debt to have increased since 2008 – indeed the main quote says “The Global Financial Crisis was the cause of the sudden change in the country’s finances,” – but it’s not my focus for this blog. The blog is one of my shortest (originally someone else’s graph, someone else’s quote, a few more comments and links and that’s all), and was written quite quickly to address one specific point (which somewhat annoyingly has also made it by far my post popular blog, presumably because people like short, simple and striking more than long and nuanced). It’s certainly not an attempt to produce a thoroughgoing analysis of which party is better with debt – though, granted, it might be being taken that way by readers, and used to promote the opposite message to Drury’s, which is almost as much of an “obvious lie.” The truth is (a) it’s more complicated than either extreme, (b) a major determinant of debt levels is responses to the economic climate, (c) this is not the only determinant, (d) the economic climate has its own determinants, (e) both National and Labour would have increased debt after the GFC, and last but not least: (f) I am not saying National should not have increased debt after the GFC, and although I tend to think they’ve been irresponsible, largely because of their tax cuts, this is a complex question that I can’t answer with any confidence. I try to do justice to this complexity more in the comments (and now in the “Update” section). Could I have made it more obvious in the main text? Sure. Should I have? Possibly.
But on the flipside it’s also dishonest to pretend (as you do) that the increase in debt is entirely due to the GFC (and possibly earthquakes), and that political parties have no agency in their decisions about revenue, expenditure and debt. In the first few comments Frank and I discuss the rhetorical move whereby right-leaning people will suggest Labour are dishonest with money/debt, and then when you point out National have increased debt more, they’ll suddenly change tack and say that it’s not National’s fault, they haven’t made any choices that have affected debt levels. This too is dishonest (and the recently-added quote from Treasury in the “update” gives the lie to this).
LikeLike
you probably dont care anymore but the thing you leave out of this analysis is that NZ ran out of money before Naitonal came into power in 2008. Go and read the 2008 PREFU – Pre-Election Economic and Fiscal Update…..NZ went into recession BEFORE the GFC,,,,,after years of growth built on debt…..http://www.treasury.govt.nz/budget/forecasts/prefu2008
LikeLike
True re: 2007-2008 global financial crisis hitting before National came to power (though the GDP graph shows its impact didn’t really show in NZ until 2009). Not true re: your implication that the recession is Labour’s fault due to “years of growth built on debt.” Debt stagnated in nominal terms and was reduced in real terms throughout Labour’s term. (They could have done even better and paid off debt in nominal terms, sure … but maintaining a low raw level, which is reducing in real terms, can hardly be classed as “growth built on debt”)
LikeLike
So I wrote a sequel blog: https://cutyourhair.wordpress.com/2014/09/16/i-am-so-sick-of-this-obvious-lie-pt-2/
LikeLike