Tagged: National party
Labour lost their special votes advantage
The final NZ election results are out, and my idle spreadsheet-fuelled predictions are proven partly but notably not entirely correct. Most significantly, Labour almost entirely lost their special votes advantage. Since 2005, Labour had always increased their vote when the final results including specials were unveiled, and actually they’d been getting better and better on specials, peaking in 2017. This year Labour did almost exactly the same on specials as on preliminary votes. So this was the worst they’d done on specials since 2002.
Here is how every party did, and then a comparison to other MMP elections…


The other noteworthy factor was that National reversed their downward trajectory on special votes, getting their best performance on specials since 2008. However, they still dropped, as they always have. Even in a good year for them on specials, they still did badly enough to lose two seats from what they had been projected on preliminary results. National losing multiple seats on specials will be increasingly normal if the proportion of votes that are specials remains high or continues to grow.
Other parties did basically similar to how they’ve done before: TPM, Green, TOP, Legalise Cannabis, and conspiracist parties doing well on specials (though some not as well as before), ACT and NZF doing badly.
So, in summary, this led to the following changes in seat numbers from the party vote (with self-indulgent comments about how this compares to the predictions in my last blog):
- Parliament will have 122 seats, with one more to come after the Port Waikato by-election. National + ACT will not be able to form a government on their own, as they will only have 59 seats (to grow to 60 after the by-election).
- In theory there are multiple possible governments, the first three of which avoid New Zealand First:
- Teal Deal: National + Green, 63 seats (to grow to 64)
- Grand Coalition: National + Labour, 82 seats (to be 83)
- Getting the Old Gang Back Together: National + ACT + TPM, 65 seats (to be 66)
- Winston Kingmakes the Left Again: Labour + Green + NZF + TPM, 63 seats.
- Three rightwing parties that dislike each other: National + ACT + NZ First, 67 seats (to be 68). In practice this is the government we will get, because all other combinations involve parties that have (explicitly or implicitly) ruled each other out.
- Labour did not pick up any seats on specials.
- This is contrary to most of my predictions.
- National lost 2 seats on specials.
- This is consistent with some of my predictions (though other predictions were that they would lose 3, which would have been nice but aah well).
- The Greens picked up one seat.
- This was predicted in most of my predictions. On some of my predictions they stayed on 14 and on others they went up to 16 but most said they’d go to 15.
- TPM picked up one more seat on party vote entitlement (however, since they won more electorates than party vote entitlement, this actually doesn’t affect their own number of seats in Parliament, just the overall size of Parliament, as discussed in probably excessive detail in the last blog).
- This was predicted in most of my predictions.
- No other party changed their seats from the preliminary predictions. ACT and NZF went down on specials as usual, but not enough to lose seats.
- This was predicted in basically all my predictions.
- There was one super hypothetical scenario on my predictions where ACT actually gained, but this coming to pass would require ACT to magically become good at specials again (and since they became a more-than-one-person party again in 2020, they’ve been bad at specials, just like the other medium-large right-wing parties are). NZF have been bad at specials for ages (retirees don’t do special votes). Realistically, ACT and NZF were definitely going to drop their vote on specials, not increase it.
How close were we to these seat numbers being different?
Changes in seats (or no change in seats) doesn’t necessarily clearly translate to change in votes, so generally it’s better to look at percentage changes in votes. Sometimes quite a small change in votes could push a party over the boundary to get one more or one fewer seats.
I’ve played around a bit, tweaking the the final numbers on the seats generator to see what kind of vote changes could have led to different seat numbers. Here are some ways that votes could have been different, leading to different seat numbers, in order of likelihood:
- If Labour had taken 0.2% of National’s total votes and 0.1% of the Greens’ votes, Labour would have won the extra seat instead of the Greens.
- If NZF had dropped 0.2% of their vote, to 5.88%, they would have gone down to 7 seats. That seat probably would have gone to National; could have been Labour, but only if almost all of these 0.2% votes went to Labour instead). But NZF still would have held the balance of power (National and ACT would have only had 61 out of 123 seats even after they get a bonus seat with the Port Waikato by-election).
- ACT had gone down from 12 to 11 in the last stages of the election day count, so they would have had a fair way further to descend for this to drop to 10. But even if it did, the votes & the seat would have realistically gone to National anyway, so wouldn’t have changed the overall size of the right bloc.
- While some scenarios had TPM staying on only 3 seats from party vote, realistically they would always have increased this to 4 as they always do so well on specials. Even if TPM had dropped 0.3% to 2.78% with (for example) 0.1% each going to Green, Labour, and National the seat numbers don’t change.
How special votes affected electorates
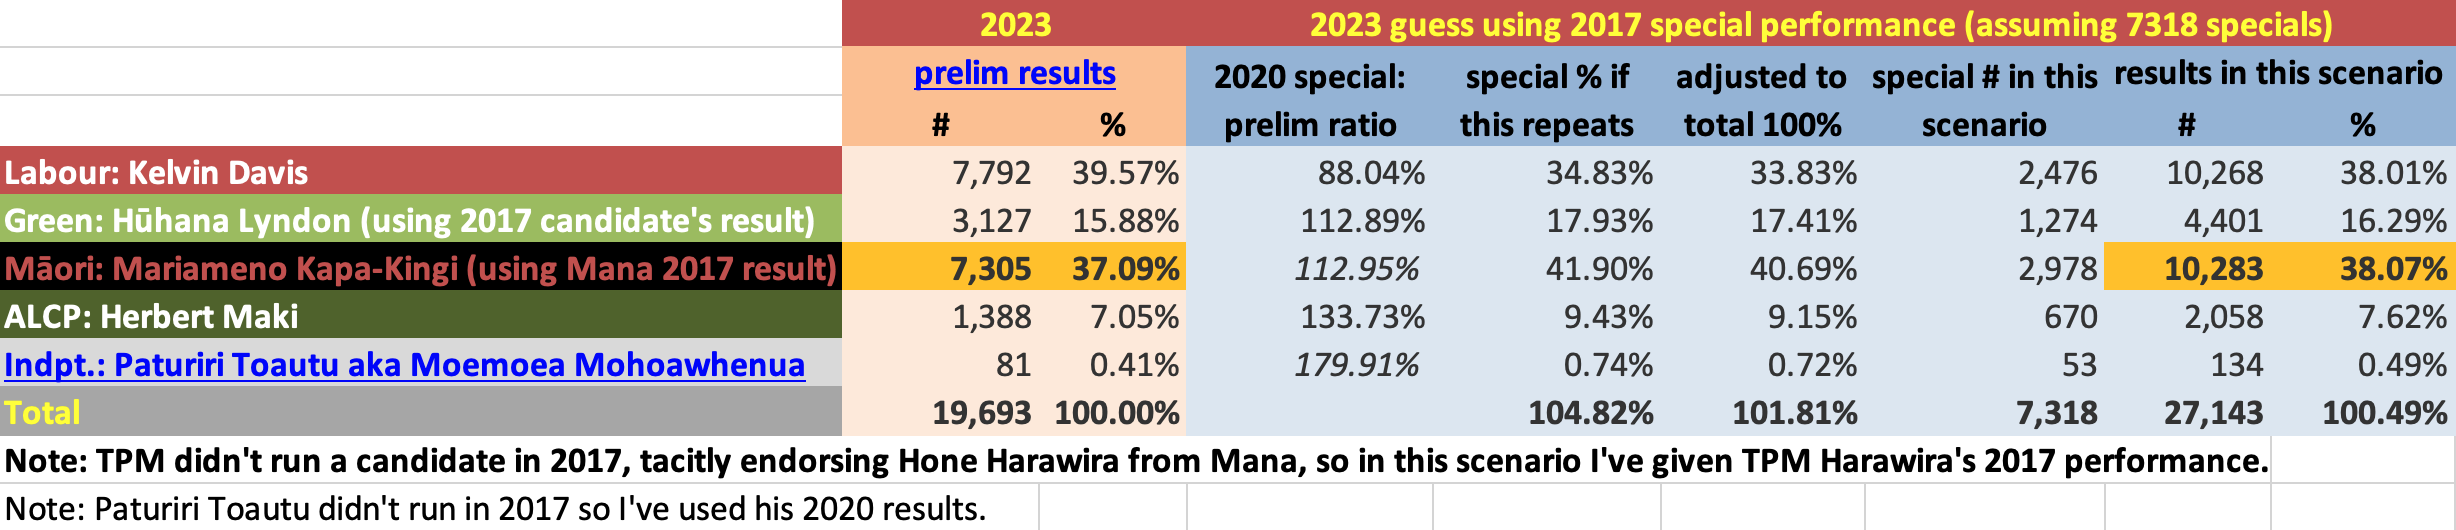
- Māori electorates: I said that Te Tai Tokerau and, likely, Tāmaki Makaurau were too close to call based on past special vote performances. 2017 and 2020 results ever-so-slightly favoured Labour’s Kelvin Davis to narrowly hold onto the seat, but with lots of uncertainty. (I lacked the data to do a projection for Tāmaki Makaurau.) It turned out Te Pāti Māori won both seats. In Te Tai Tokerau, TPM’s Mariameno Kapa-Kingi actually turned a 500 vote preliminary deficit into a 500 vote win by winning 3000 extra votes from specials to Labour’s Kelvin Davis’ 2000… big numbers considering Kapa-Kingi won with only 10,428 votes total. In Tāmaki Makaurau, the margin of victory for the TPM candidate is only four votes… yes, four single votes… so this will go to a recount and is essentially a tie. But TPM’s performance especially in TTT was likely helped by TPM delivering their normal excellent special votes performance while Labour failed on specials. Here are tables with the Te Tai Tokerau results this year and compared to 2017 and 2020.


- General electorates: I said in my last blog as a vague hunch that one or two seats would probably flip from National to Labour on the final count. In fact two did (Nelson and Te Atatū). I also added a more specific guess on the morning before final votes were announced when I saw a list of four seats identified as close (the Labour candidate just ahead in Mt Albert on preliminary votes and the National candidates just ahead in Nelson, Te Atatū and Banks Peninsula). My last minute guess was that Labour would win all four of these. I was right about three out of four but in Banks Peninsula, the National candidate actually extended their lead on the final count and won the seat by a relatively comfortable margin of 396 (after being 83 ahead on the prelim count).
Why the changes this time?
This is all entirely speculative.
I have three possible theories about why Labour did no better on specials than ordinary votes this time, and the first two of them would also be reasons why National did less bad on specials than they had been doing. There are not really any other significant changes to explain about other parties.
- A theory that some pundits were predicting was that overseas voters would abandon Labour because they were annoyed about the border closures and compulsory user-pays quarantine for people wanting to come home. This may explain some of it, even though overseas voters are only 78,030 or 12.9% of special votes. I will admit I have been sceptical about this theory, because I was an overseas voter who suffered a government that literally wanted to let the elderly die (and to a large extent succeeded in that), looking in at NZ’s best-in-world COVID policy and feeling more warm towards NZ Labour than I probably ever had before. Also, I had no intention to come back while MIQ was in place. However, I am willing to grant that the picture would have looked quite different to an overseas voter in Australia whose own government didn’t do too bad (relatively), who has always expected it would be relatively easy to pop back home, and who really wanted to come home in 2021 when a lot of other countries were giving up on COVID protections but Aotearoa wasn’t. So maybe there is truth to this pundits’ theory.
- Labour seemed to narrow the gap with National near the end of the electoral campaign when Hipkins finally had a good debate and National were going off the rails saying, basically, that the government with ACT and NZ First that they were (and are) set to form would be bad and that NZ First are racist but that they will work with them anyway, etc. Labour did somewhat better and National did somewhat worse on votes cast on the day than on advance votes (compare: advance ordinary votes with preliminary votes). So IF special votes are more likely to be advance votes, then this could explain why special votes were more National-leaning than Labour-leaning. BUT I don’t know if special votes are more likely to be advance votes or not. I’ve asked the Electoral Commission if this info is available (yes. I am a nerd.).
- A lot of special votes are students or people who move around a lot, who are staying outside the electorate in which they’re enrolled when the vote. A lot of others are first-time voters who enrol and vote on the same day. (I’m not sure if we have the data on how many of each group there are.) These groups are generally left-leaning and may have taken issue with Labour watering down climate commitments, not delivering on Ardern promising to prioritise it as “her generation’s nuclear free moment,” again ruling out any kind of wealth or capital gains tax, and failing to do anything about housing unaffordability. Ardern was a cautious centrist Labour leader, more timid than Helen Clark even after getting an unprecedented majority vote in 2020, and Hitchens pitched himself further right than that, offering no hope of any action on the major issues affecting the world and the future. Some of these voters may have gone back to the Greens or TPM (or voted Green or TPM in their first election instead of voting Labour). Perhaps similar to the demographics who (on both ordinary and special votes) abandoned Labour for Green or TPM in electorates like Rongotai, Wellington Central, and the Māori electorates.
National could drop 3 seats on the final count y’know, or: Blog in Which Spreadsheets Drag Me Back Into NZ Political Blogging after Three Years
Warning/promise: lovely spreadsheets and infodumps follow. Since I last blogged I’ve learned I’m autistic, and I’m leaning into it.
We’re most likely staring down the barrel of Winston Peters, noted liar and stoker of conspiracism and surely Aotearoa’s most powerful politician of recent decades, again entering the government. If he keeps his word (big if) and if Labour, Green and Te Pāti Māori do, he will not this time be playing the left and right blocs against each other. Instead Winston First (H/T my friend Peter for that name) will “kingmake” Christopher Luxon as PM, with ACT also playing a role in the government. This may mean NZ First and ACT cancel each other out on the severity of neoliberal capitalism, but grasp hands and go forth in unity on opposing Te Tiriti. It will mean a lot of clashing egos.
However, NZF holding the balance of power wasn’t immediately clear when the election results came pouring in, as early results had National and ACT with an outright majority on their own. In fact, even at the end of election night, provisional votes showed Nat+ACT with the slimmest possible majority (61/121 seats) if final vote %s match provisional vote %s.
But the final vote % never do match the provisional vote %s. The release of the final count with all the specials always leads to different results to those projected from preliminary results. National will almost certainly “lose” seats (i.e. end up with fewer seats than the 50 they are projected to get on prelim votes) – unless things go very differently this election than previous ones. This much is clear to anyone who’s ever been nerdy enough to play with election results in a spreadsheet.
This blog represents the results of me doing said spreadsheeting (updating my analysis from six years ago: 1, 2). If you are interested in looking at my spreadsheet for yourself, it’s here.
You may also enjoy the work of Graeme Edgeler or the NZ Herald. Full disclosure: Edgeler seems to have different numbers to me from the 2020 election (eg he says National did 22% worse on specials than preliminary vote, whereas I make it 26%). I can’t figure out whether we’re using a different calculation or slightly different category of votes or whether one of us has made a mistake. The Herald seems to use the same numbers as me for past elections. But they get a slightly different projection of seats when using the 2020 election as a predictor (not when using the 2017 one). I think this must be due to slightly different rounding used (and rounding is unavoidable to squish one election’s patterns into another election, as explained below).
Anyway, here’s the TL;DR: On almost all special vote calculations I do, National are predicted to win 47 or 48 seats (as compared to 50 projected from preliminary results) and ACT are predicted to win 11 (the same as predicted in preliminary results). Add in National’s expected extra overhang seat after the Port Waikato by-election and National and ACT are looking at either 59 or 60, and Parliament will have at least 121 MPs after the by-election, theoretically as many as 124. So National will need NZF as well as ACT (unless they can make it work with another party. Which they can’t).
Labour, Green, and/or TPM are set to gain seats from the preliminary projection. Between them, on all these scenarios, these parties gain the 2-3 seats that National lose on party vote entitlement. TPM’s situation is complicated. They would not actually get an extra seat if they gain one more on party vote entitlement, because they currently have one more electorate than party vote entitlement. They could, however, gain up to 2 more electorate seats where they are nipping at Labour’s heels on preliminary votes.
Now for a couple of skippable sections of info before moving onto the good stuff (i.e. the numbers and the lovely screenshots of spreadsheets).
How we can predict special vote results from available info (because sadly this isn’t as simple as you might hope)
We have the preliminary votes and turnout from this year (2,254,441 preliminary votes) and the expected total number of special votes according to the Election Commission (570,000). And we have the counts of both preliminary and final votes for all the previous MMP elections (except the first one, 1996, where I have never found the preliminary vote count online). By deducting the preliminary votes from the final count, we basically have the number of special votes cast for each party and candidate.
(Technically the difference between preliminary and final account is not the exact number of special votes. This is because when counting special votes, they also re-count all non-special votes and sometimes discover mistakes. Eg in 2020, HeartlandNZ actually went down from 1,293 on the preliminary count to 914 on the final count; this obviously doesn’t mean that they got a negative number of special votes. I don’t know how common these mistakes are, but I just have to hope that basically the difference between the counts is roughly equal to the number of specials, or else this whole exercise is even more of a waste of time than it already was.)
Anyway, with this info we can predict how many special votes each party will get by predicting whether they’ll do better or worse on specials than they did on preliminary votes. Some parties typically do better on specials (most left wing parties, especially small ones) and some typically do better on prelim votes (most right wing parties). If we predict that a party will do twice as well on specials as on preliminary votes, and they got 10% of preliminary votes, then we predict they’ll get 20% of specials. So then we predict 20% of the 567,000 expected special votes, add that to 10% of the preliminary votes and voila, we can predict their final votes and percentage. (That example party will obviously hope there are lots of specials.)
How do we predict how parties will do on specials compared to preliminary votes? By past performance of them or (more tentatively) similar parties. Maybe (also more tentatively) by speculating about whether specific conditions of this election or this party at this time will make them do better or worse on specials than normal. (For example, some people are guessing that overseas voters, who are some of the special votes, will either love Labour for doing better at saving lives from Covid than any other government, or hate them for stopping them from coming home for too long in the course of that saving of lives.) Then you can punch in your predicted final party vote %s into the MMP seat allocation calculator to calculate numbers of seats from those predicted numbers of votes.
Here is each party’s/category of parties’ previous special votes performance, by which I mean their % in specials compared to their % in prelims. (E.g. if a party gets 10% of preliminary votes and 9% of special votes, their special performance/% in specials compared to % in prelims will be 90%).
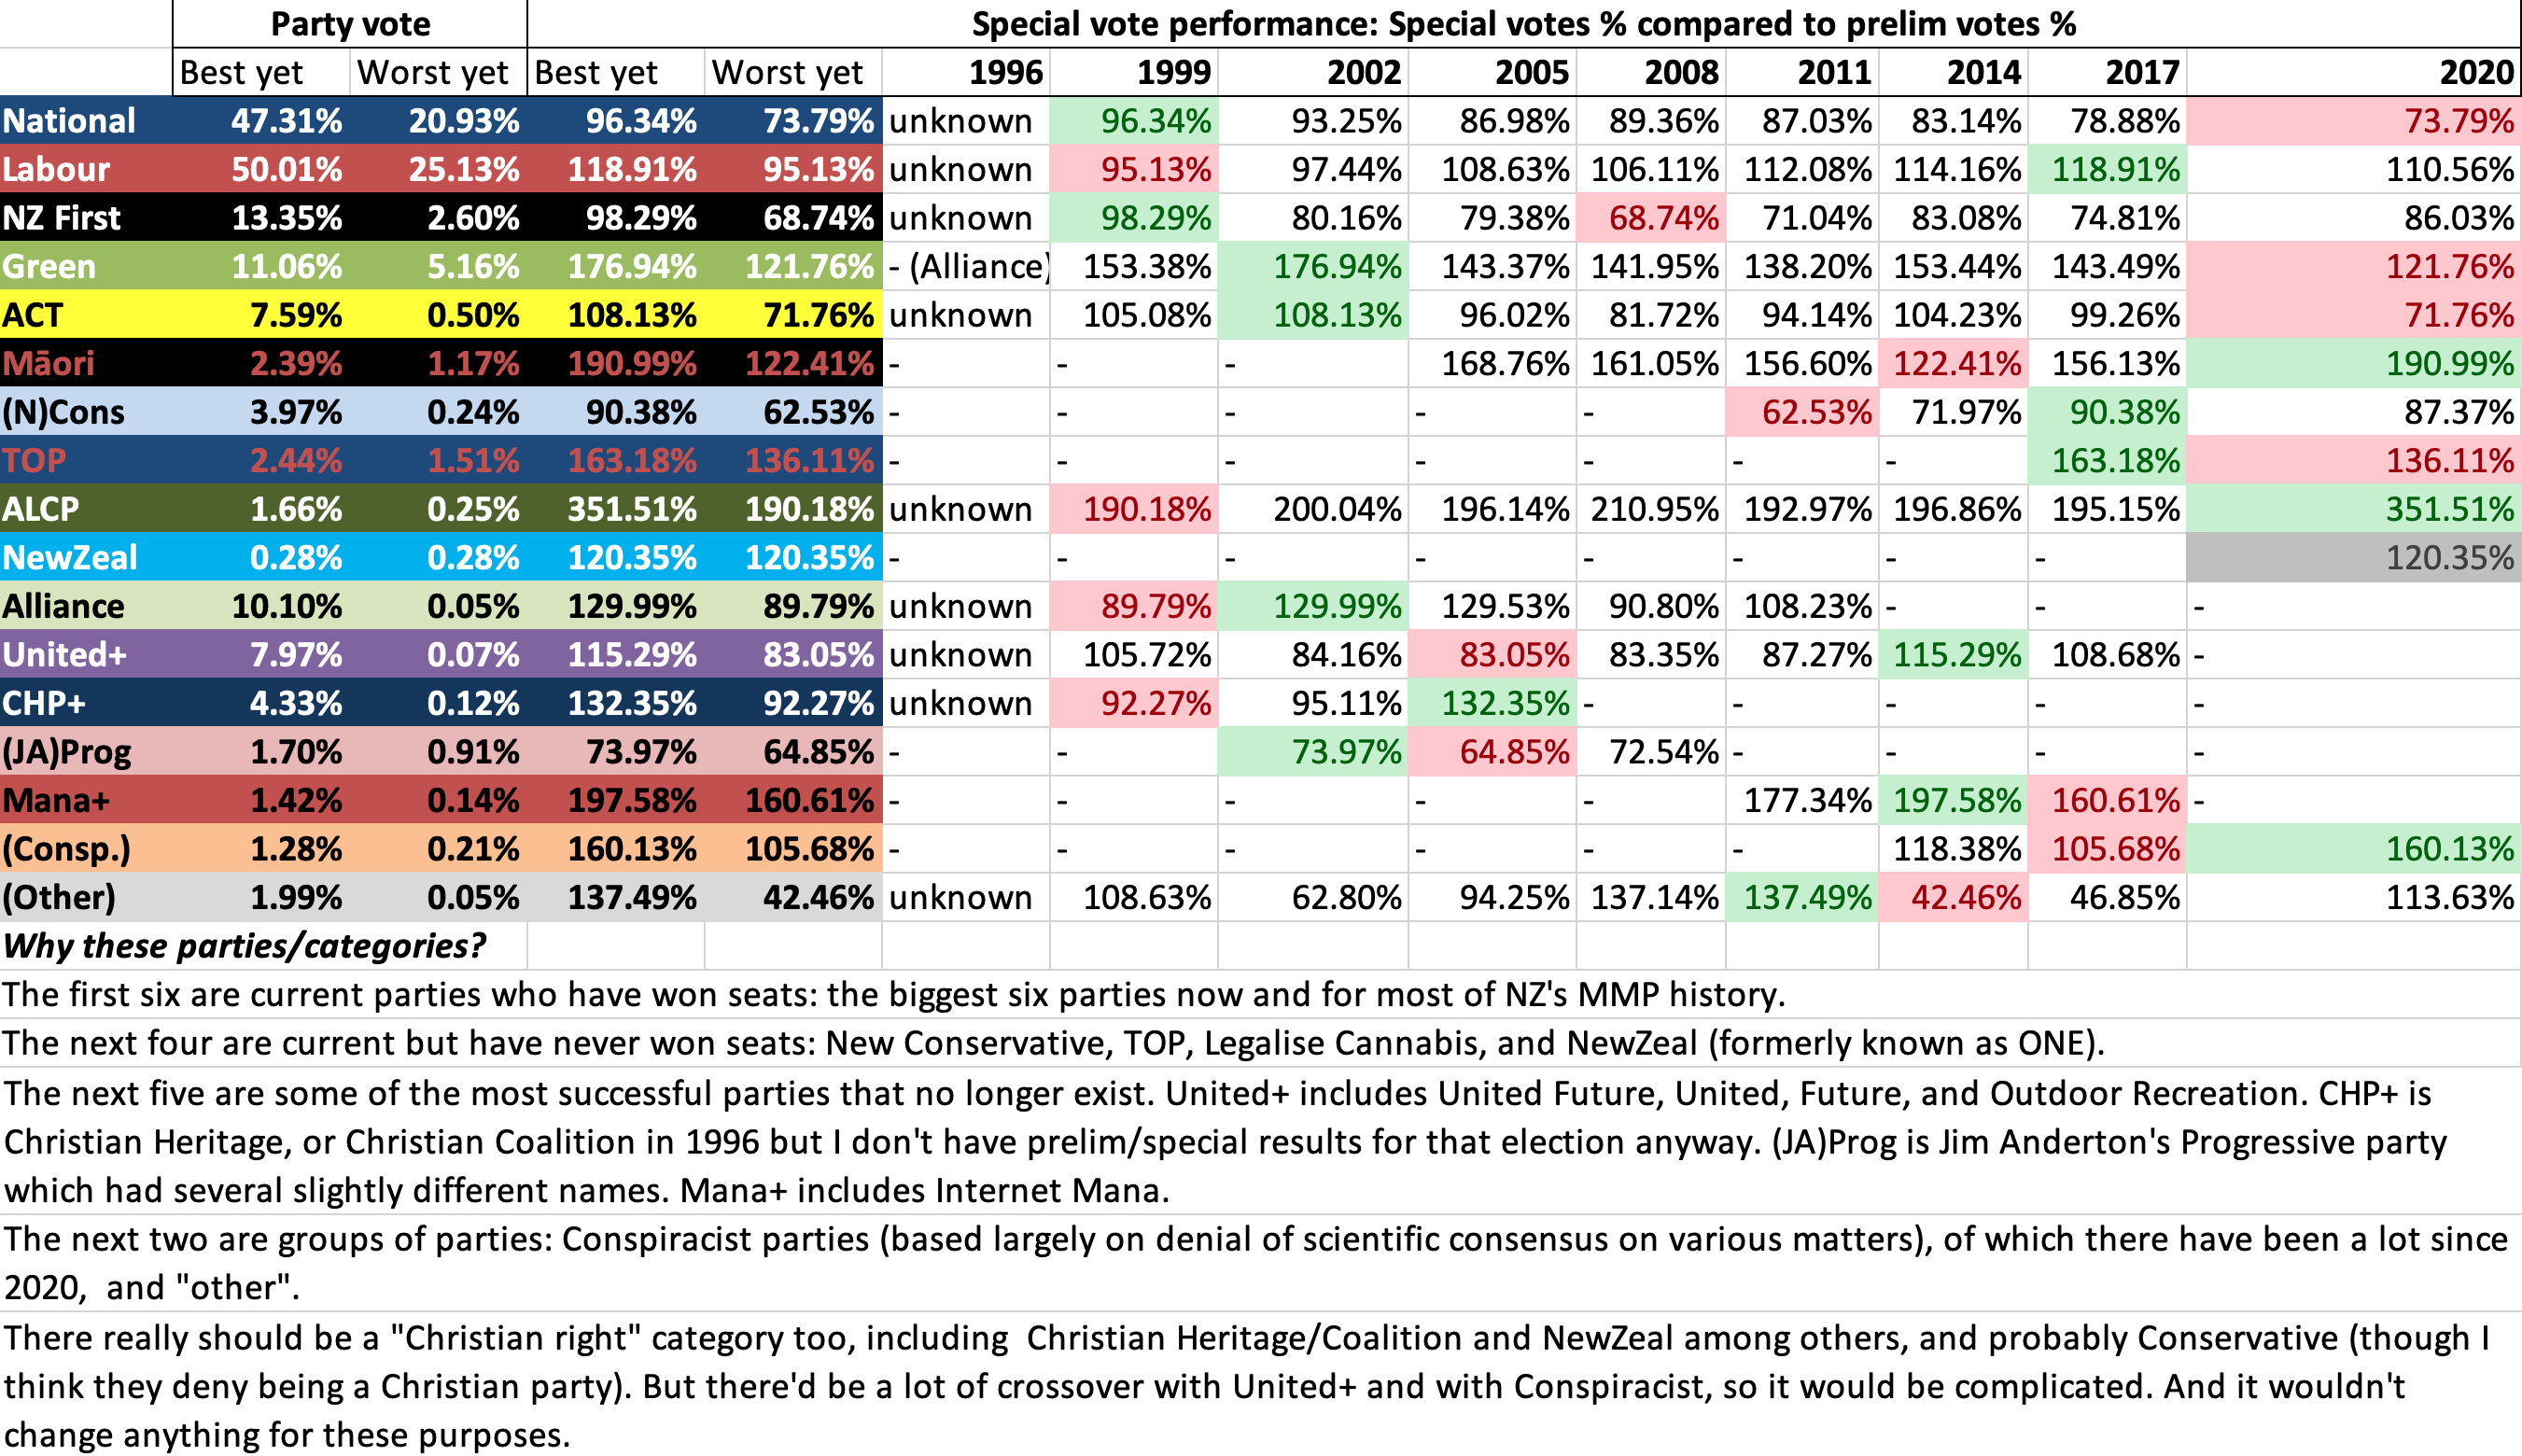
So when doing this kind of prediction, people often say “assuming all parties do the same on specials as they did in 2020/2017/etc.” Unfortunately, this isn’t actually possible. This is because the original prelim vote numbers are different. So if you assume everyone gets the same specials:prelim ratio as another election, you will end up predicting the wrong number of total votes. Eg: last election, parties who do well on specials won a majority, but this election, parties who do badly on specials won a majority. So if everyone did exactly as well as last time on specials compared to prelim votes, there won’t be enough parties doing well on specials to make up 100% of the votes: to be precise, it would only account for 96.9% of votes. So you have to adjust the predictions either up or down to make it match up to 100% of votes. (If you don’t do this, and just punch in your not-equalling-100% predictions into the MMP seat calculator, the calculator will do this adjustment automatically.) These adjustments mean that you’re not actually saying everyone did the same as the comparator election. What you are saying is that the ratio of everyone’s special performance to everyone else’s is the same. So that’s what I’m doing in the “adjusted to make 100%” columns in the tables below – evenly adjusting all the numbers in the column to the left either up or down to make the scenario actually make sense.
On overhangs (also not simple)
Sometimes a party wins more electorates than the number of seats their party vote entitled them to. When this happens, they don’t have to give back any electorates, and they don’t get to take anyone else’s party vote seats. Instead they add extra seats to Parliament beyond the regular 120. This is called an overhang and we can say that a party effectively has “overhang seats.”
On preliminary votes Te Pāti Māori is winning four electorates but only has enough party votes for three seats, so there is an overhang of one. TPM is expected to improve both its party vote and its electorate vote on specials, but we don’t know by how much. Their party vote could go up so that they qualify for four seats on party vote, thus no overhang if they win the same four electorates they’re currently winning. Or they could win one or two other electorates where they aren’t too far behind Labour on prelim votes. So they could have anywhere between 4 and 6 total seats and create an overhang of anywhere between 0 and 3.
There is also a by-election in late November in the Port Waikato seat due to the sad death of a candidate during advance voting. The rules say when this happens, the electorate is not decided at the general election, but instead in a by-election a few weeks later. And the seat becomes an overhang seat, even though it most likely wouldn’t have been one if it was decided in the general election. National is almost certain to win this seat; Labour aren’t even running. So National will also gain an extra overhang seat in a few weeks and have one more seat than their party vote in the general election qualifies them for.
Alright, now for the figures of my predictions. I have used several different methods to predict party vote results and also done a quick calculation to give an indication about the Māori seats.
Predicting using past election results
As explained above, we have to adjust up or down to make the numbers work, so predicting using past election results is not a reproduction of actual special vote performances from past elections, but a reproduction of the ratio of the parties’ special vote performances to one another.
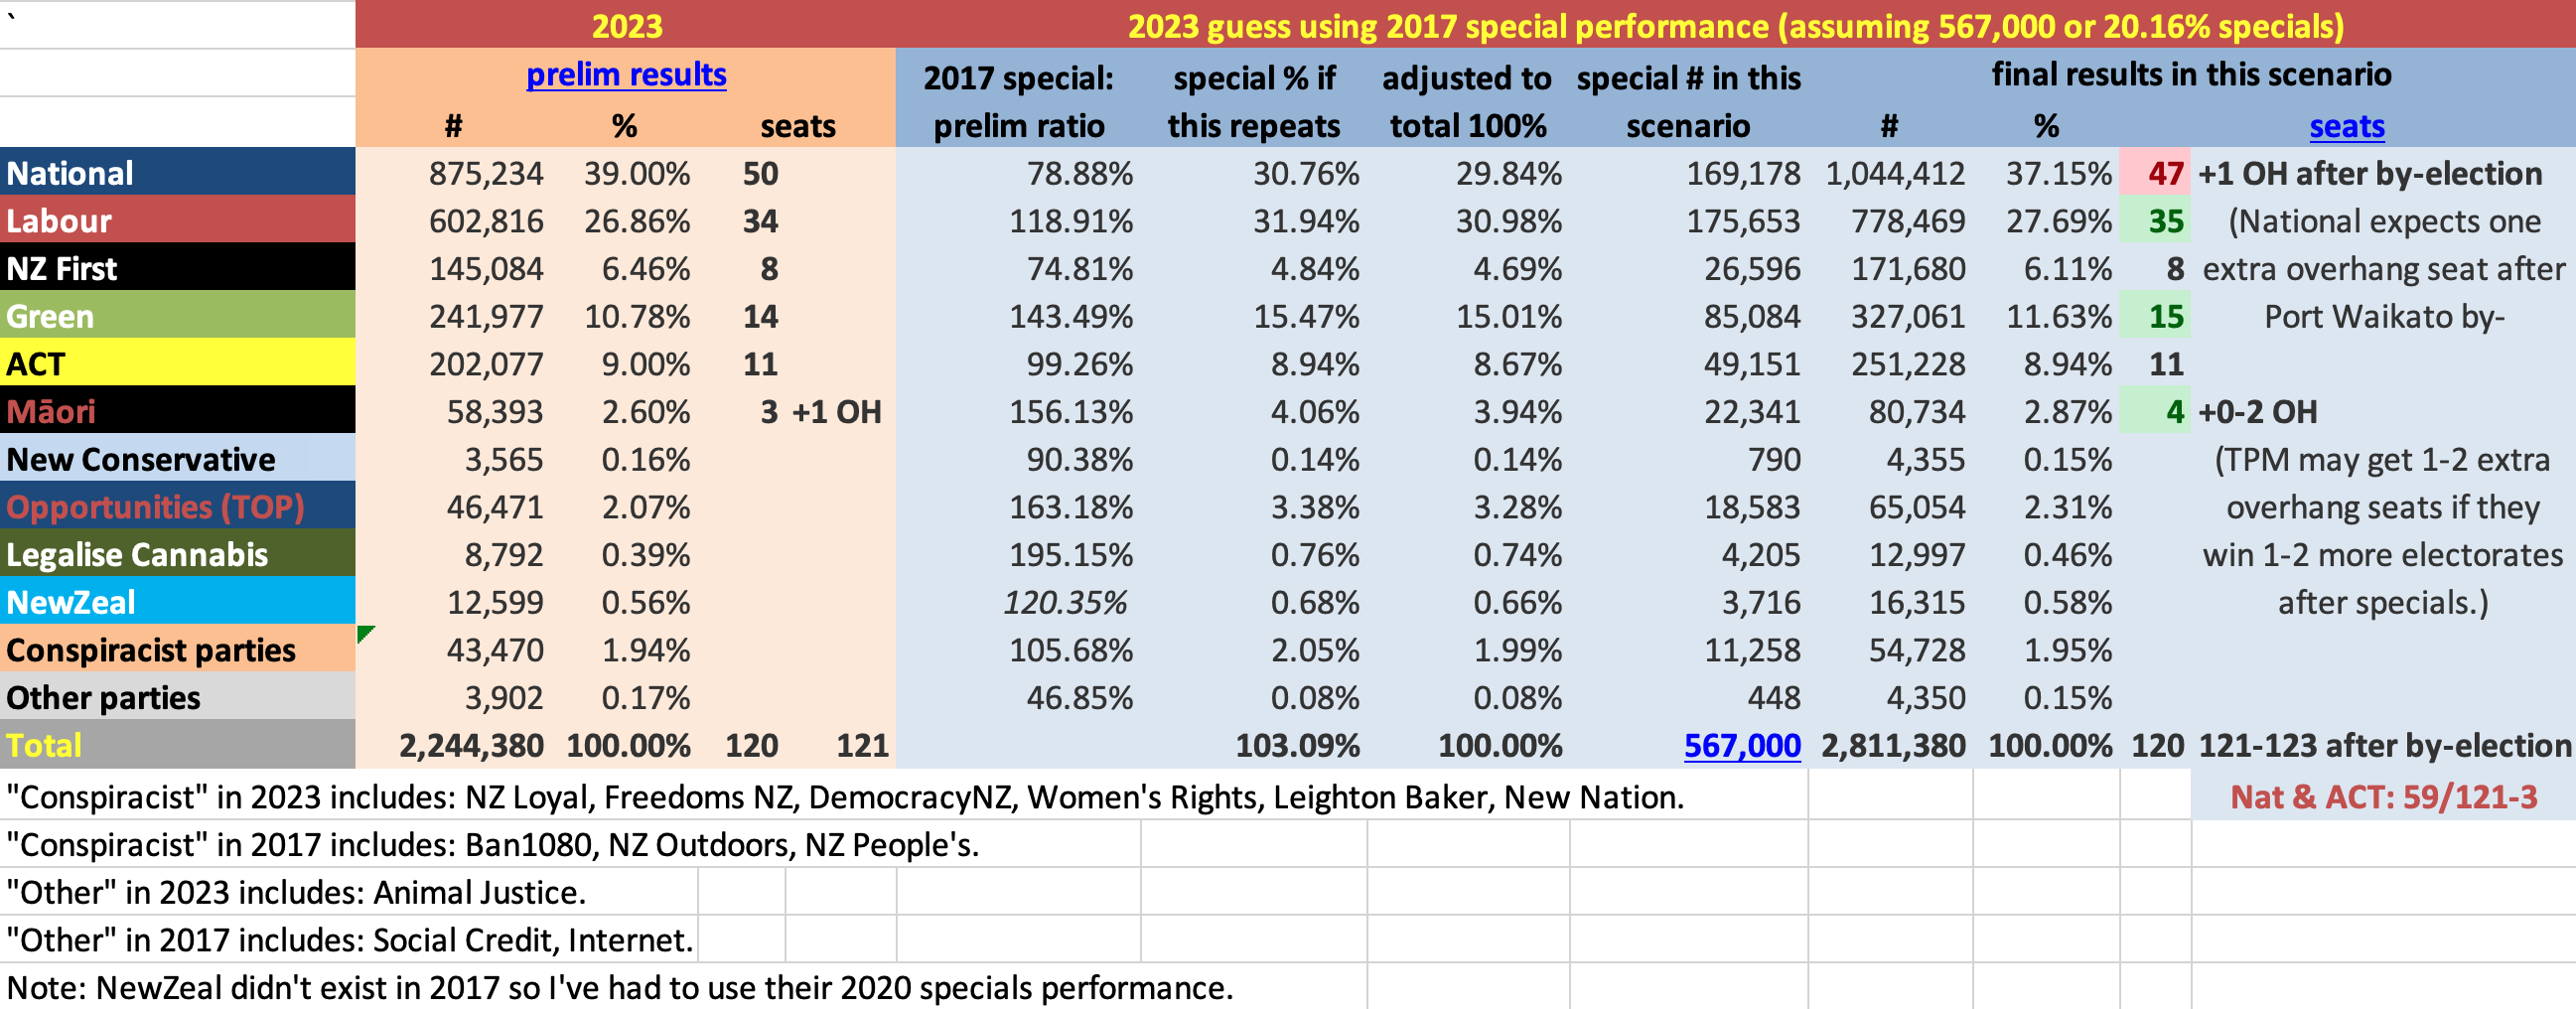
Anyway, if we do this with the 2020 or 2017 party votes, both quite different elections, we get the same results when translated to number of seats: National gets only 47 seats, 3 less than predicted on the preliminary count. Labour, Green, and TPM each gain one seat on party vote entitlements. TPM’s seat doesn’t actually give them any more seats, it just catches their party vote entitlement up to the four electorates they’ve won, thus removing the overhang (though as mentioned above, they could also win 1-2 electorates, thus an overhang returns.)
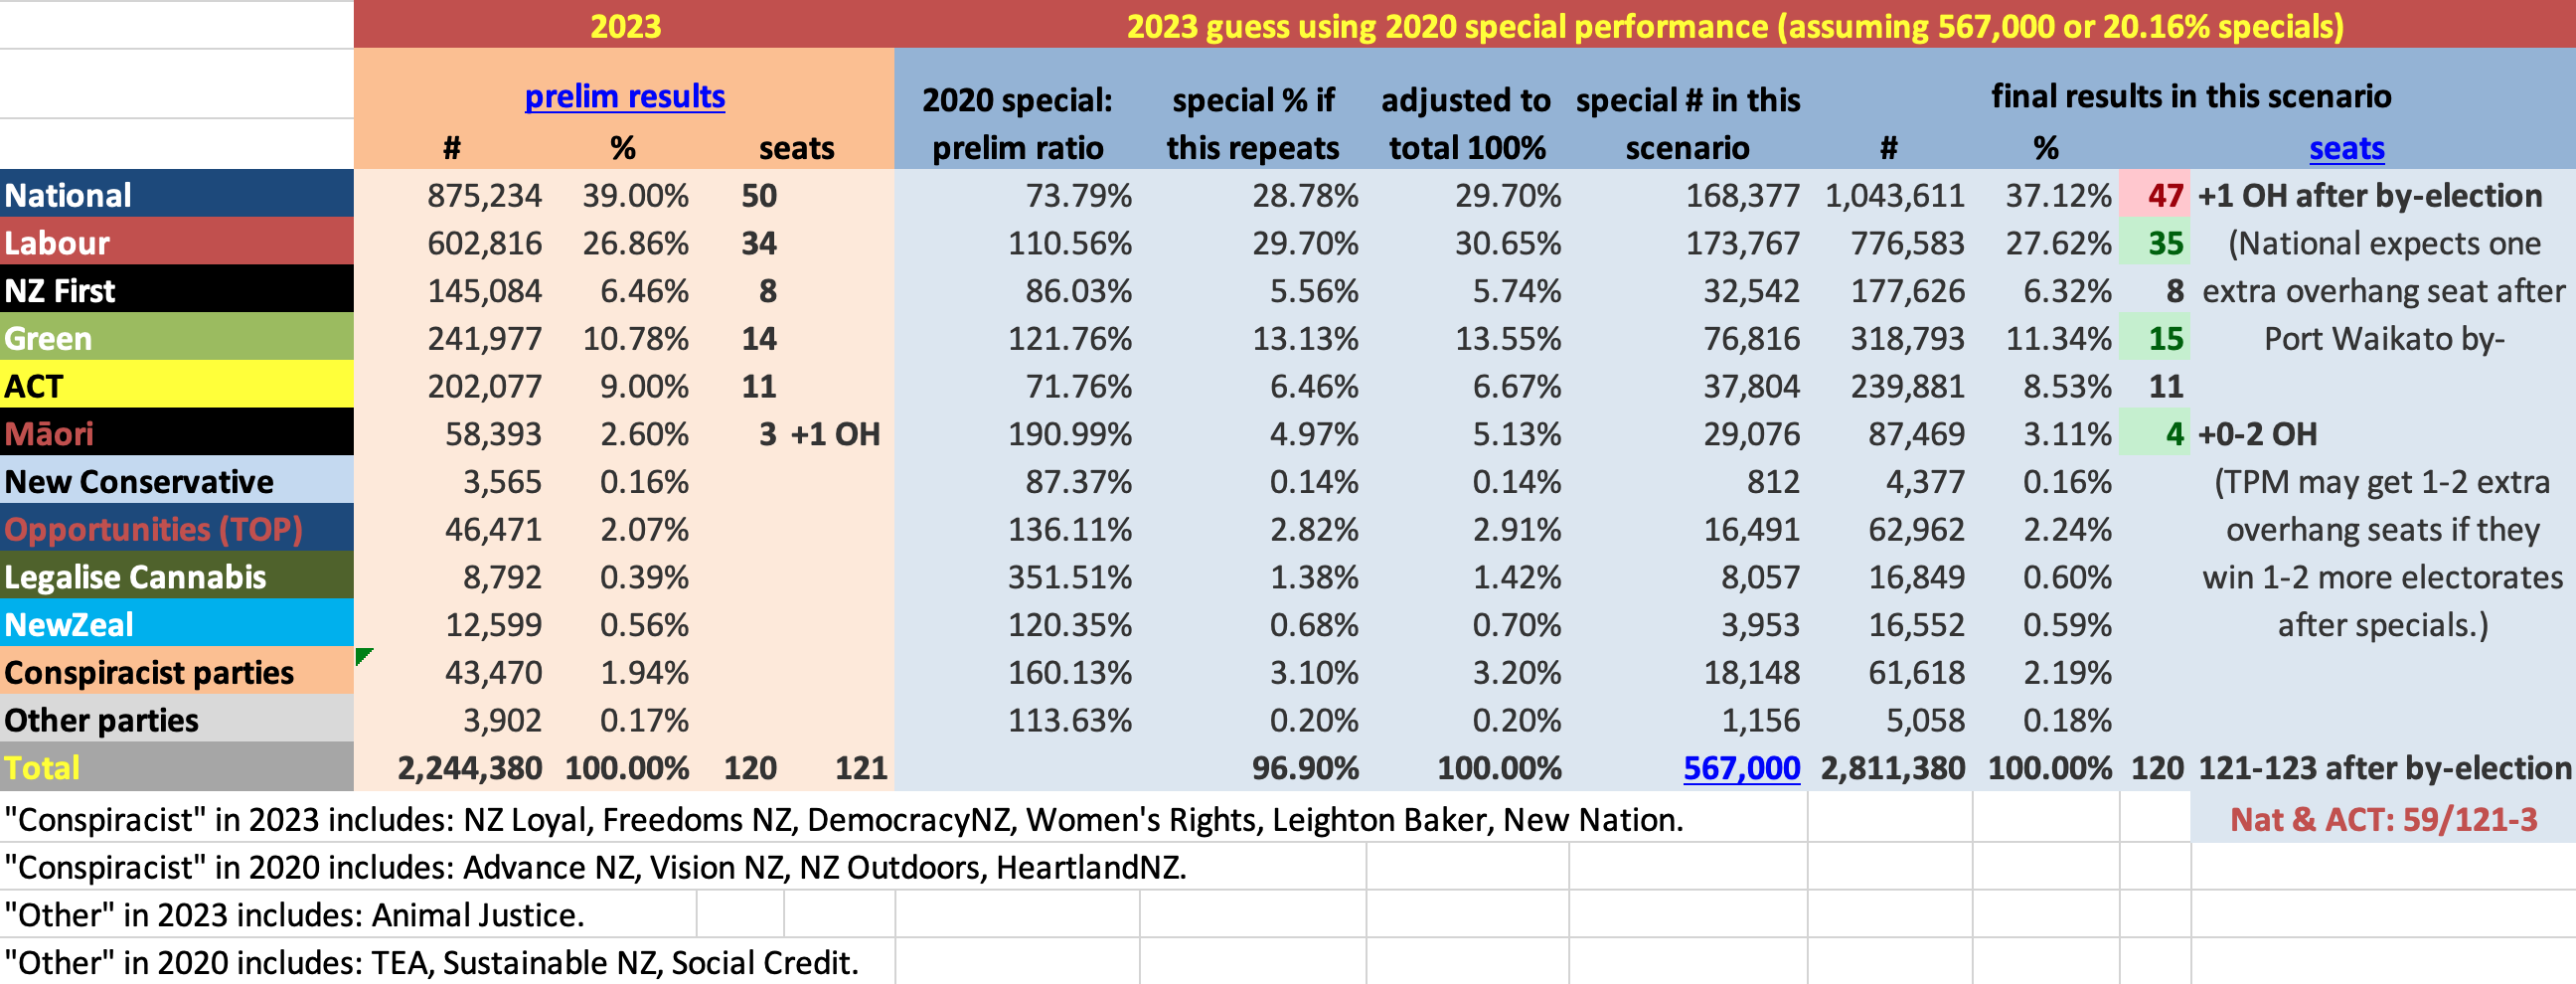
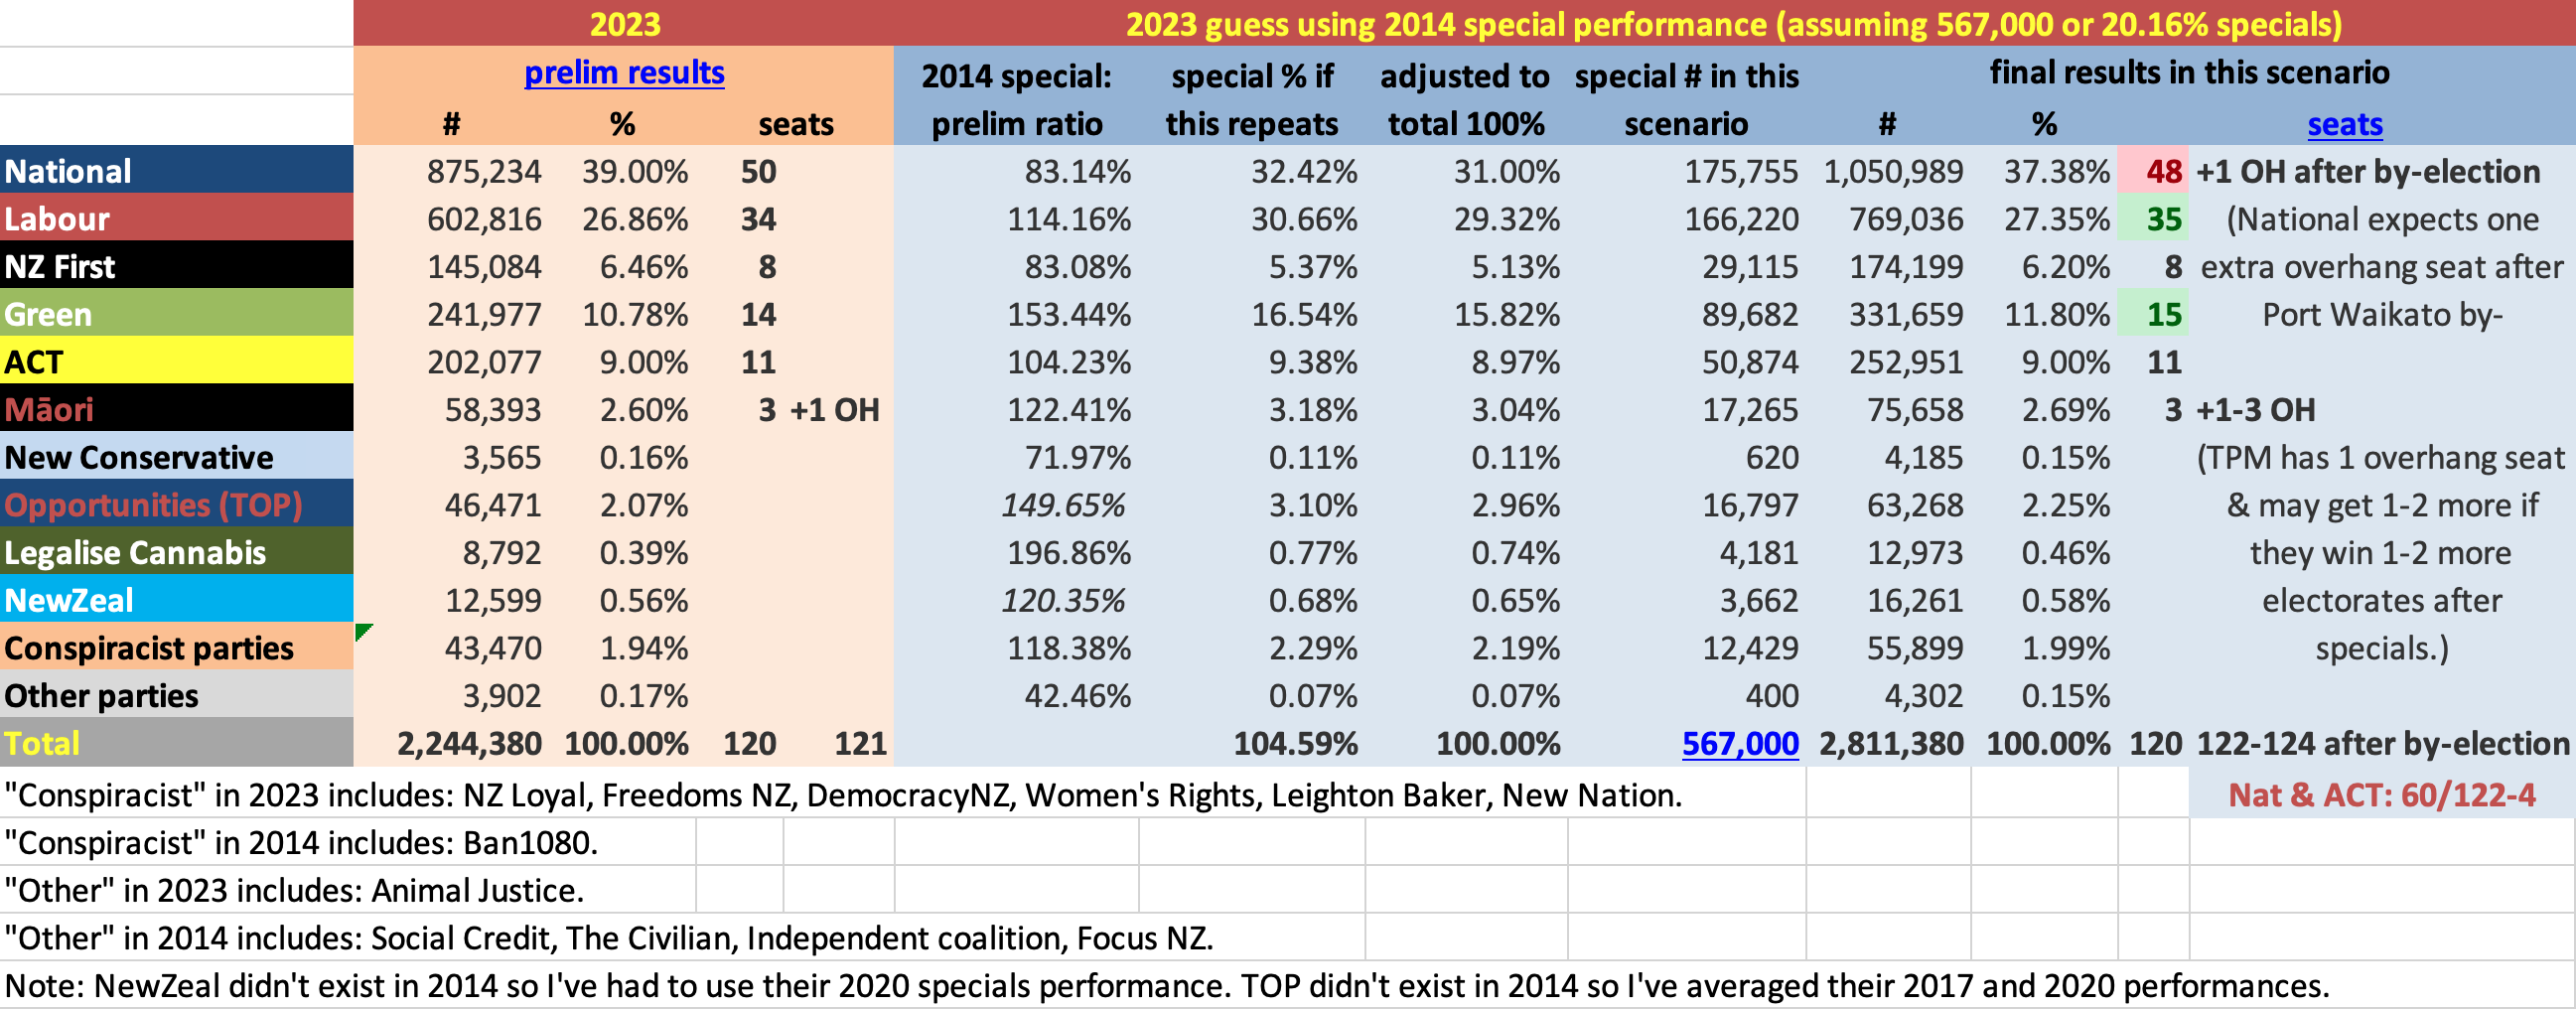
If we do this with the 2014 results, National only loses two seats, which go to Labour and Green. TPM doesn’t gain any more seats in their party vote entitlement, so there is an overhang of one seat from their four electorate seats (with potentially 1-2 more overhang seats).
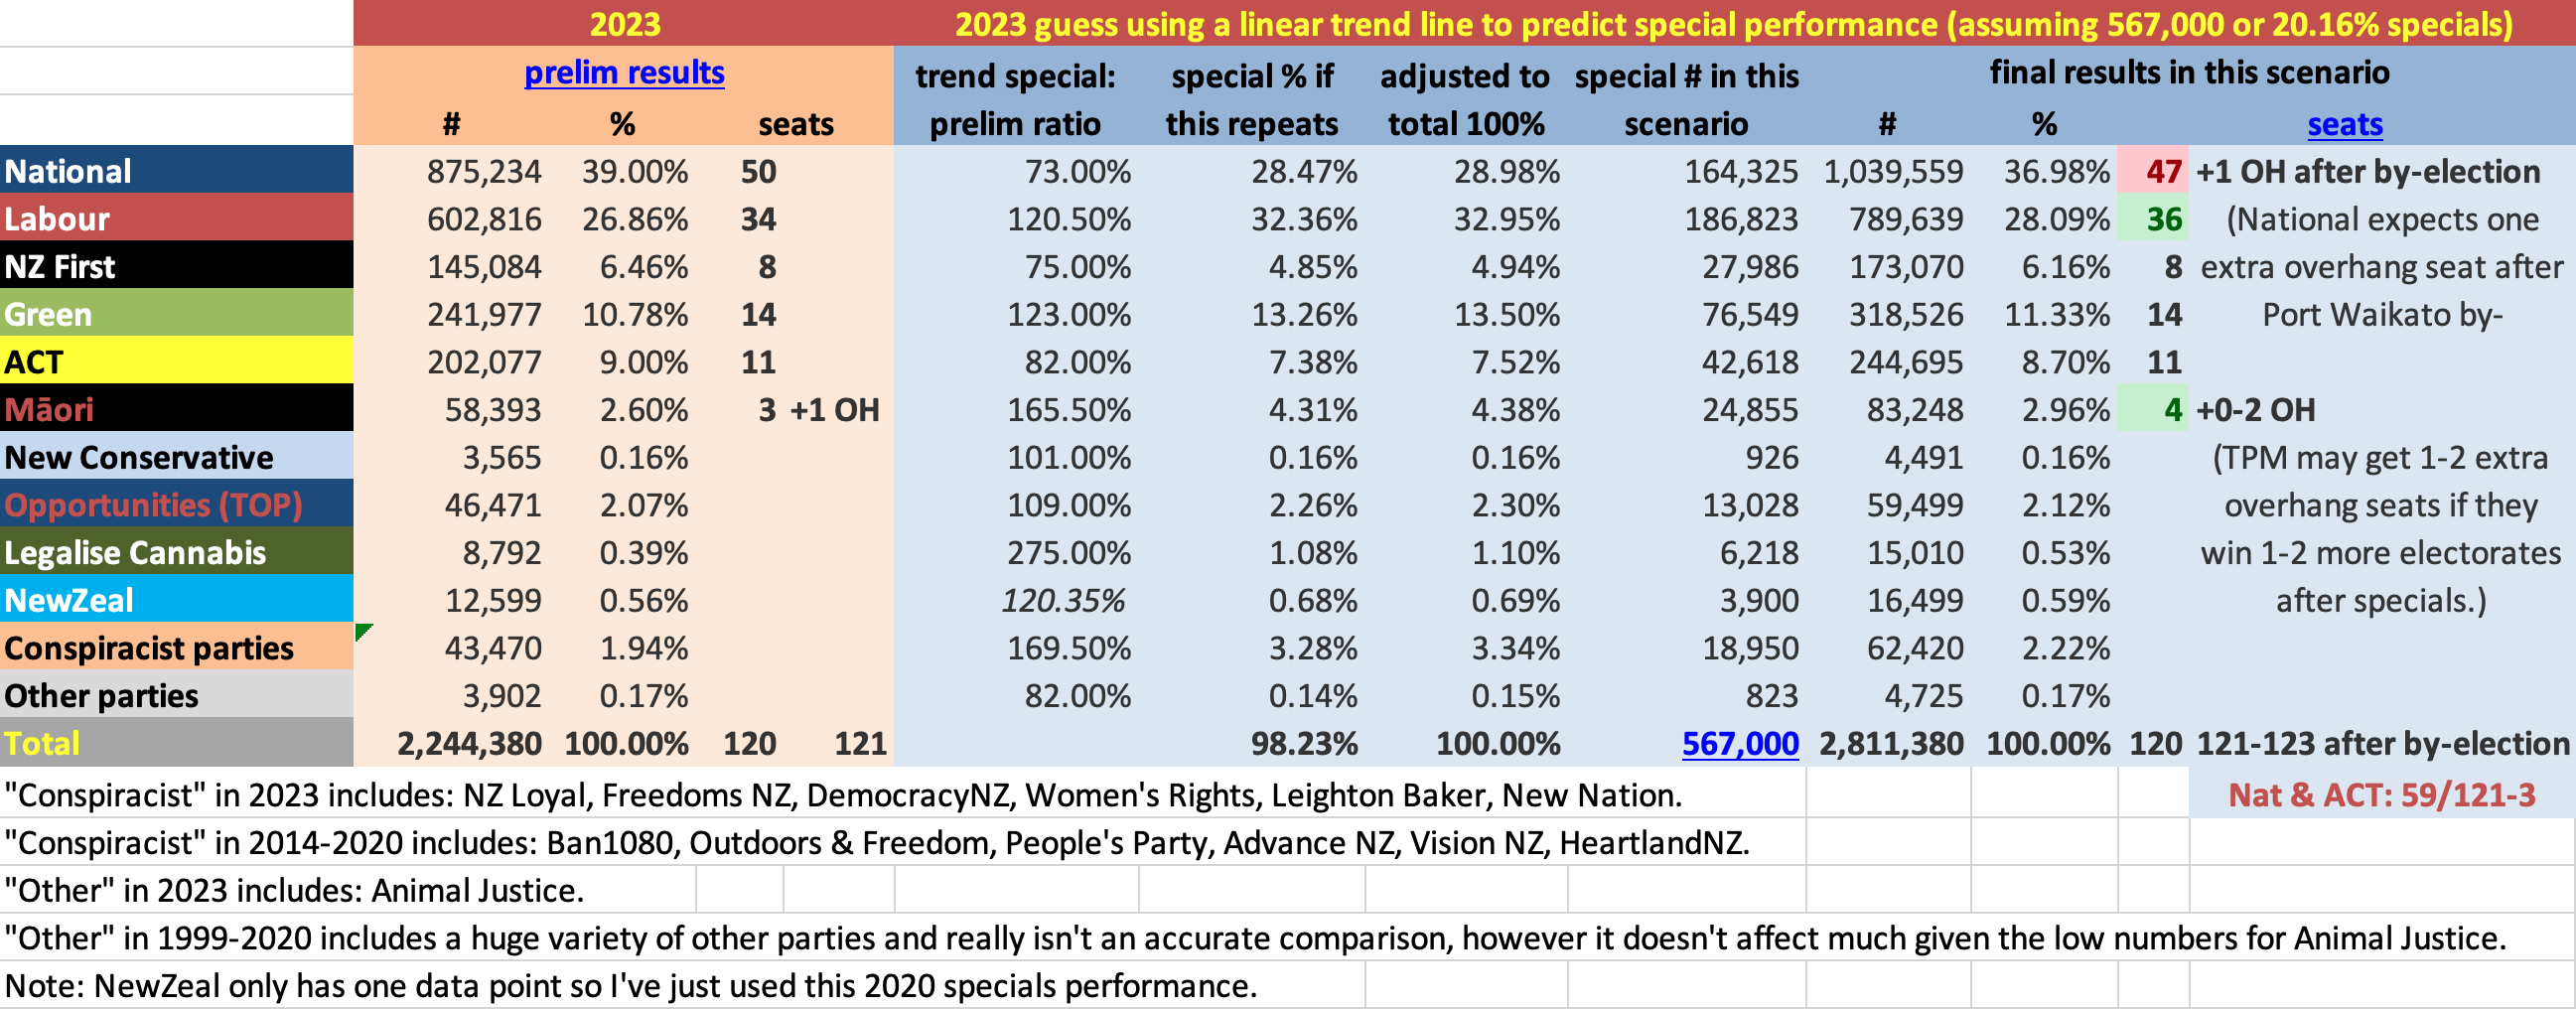
Predicting using a trend line
I figured out a linear trend line for each party’s results from 1999 or from when the party first contested the party vote up to 2020, and looked at where the line points for 2023.
I’m not a statistician so I don’t know if this is a good thing to do. I don’t know whether the votes follow linear patterns, or how to tell. Or whether another form of trend line would have been better. I do note, though, that these numbers produce predicted numbers of votes that come closest to 100% of any of my calculations, and thus they require the least adjustment.
On these calculations National again loses 3 seats, but this time two of them go to Labour and none to Green (probably due to Green having their worst ever specials performance of 122% last election, but Labour generally trending better, making their trend line predictions almost the same, which is probably not accurate). The other party vote seat lost by National goes to TPM (i.e. it reduces the overhang).
Predicting ‘best ever’ or ‘worst ever’ scenarios
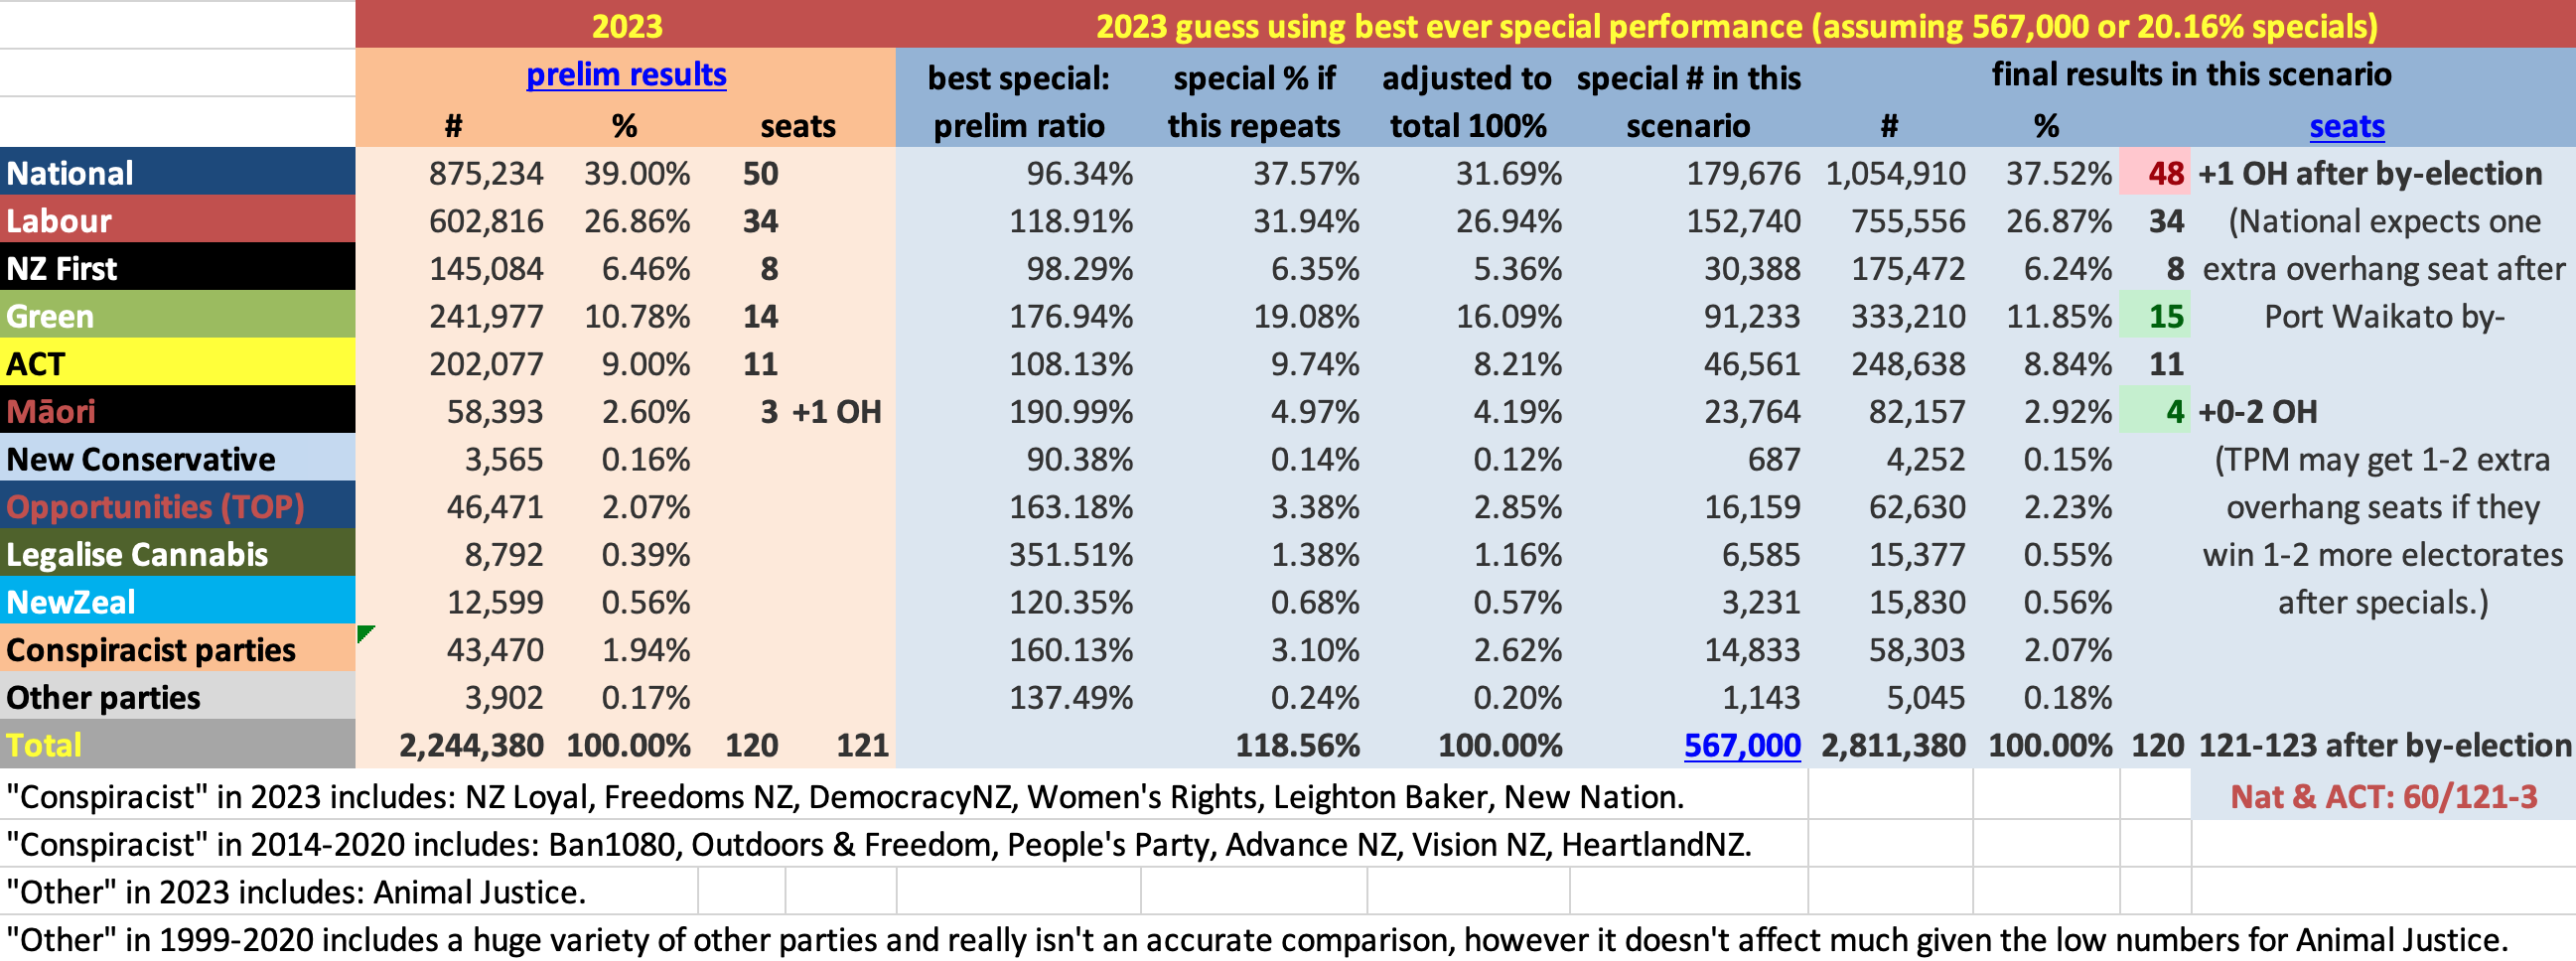
Here I have tried plugging in each party’s best ever and worst ever previous special vote performance going back to 1999 or whenever each party started. This involves some deep dives e.g. back to 1999 when Labour actually did worse than National on specials. I only really did this one for curiosity. Obviously, not everyone can do their best or their worst on the same night in a zero sum game like a set of votes. So these numbers need huge amounts of adjustment (from 118.56% and 88% down/up to 100%), meaning no party actually ends up doing that amazingly well or badly after all on the adjusted numbers.
However, it’s interesting to note that even though this is a completely artificial set of numbers, the outcomes aren’t too different to the above (or to each other). In both these scenarios, National loses two seats which go to Green and TPM (i.e. one more MP to Green and reducing the overhang by one).

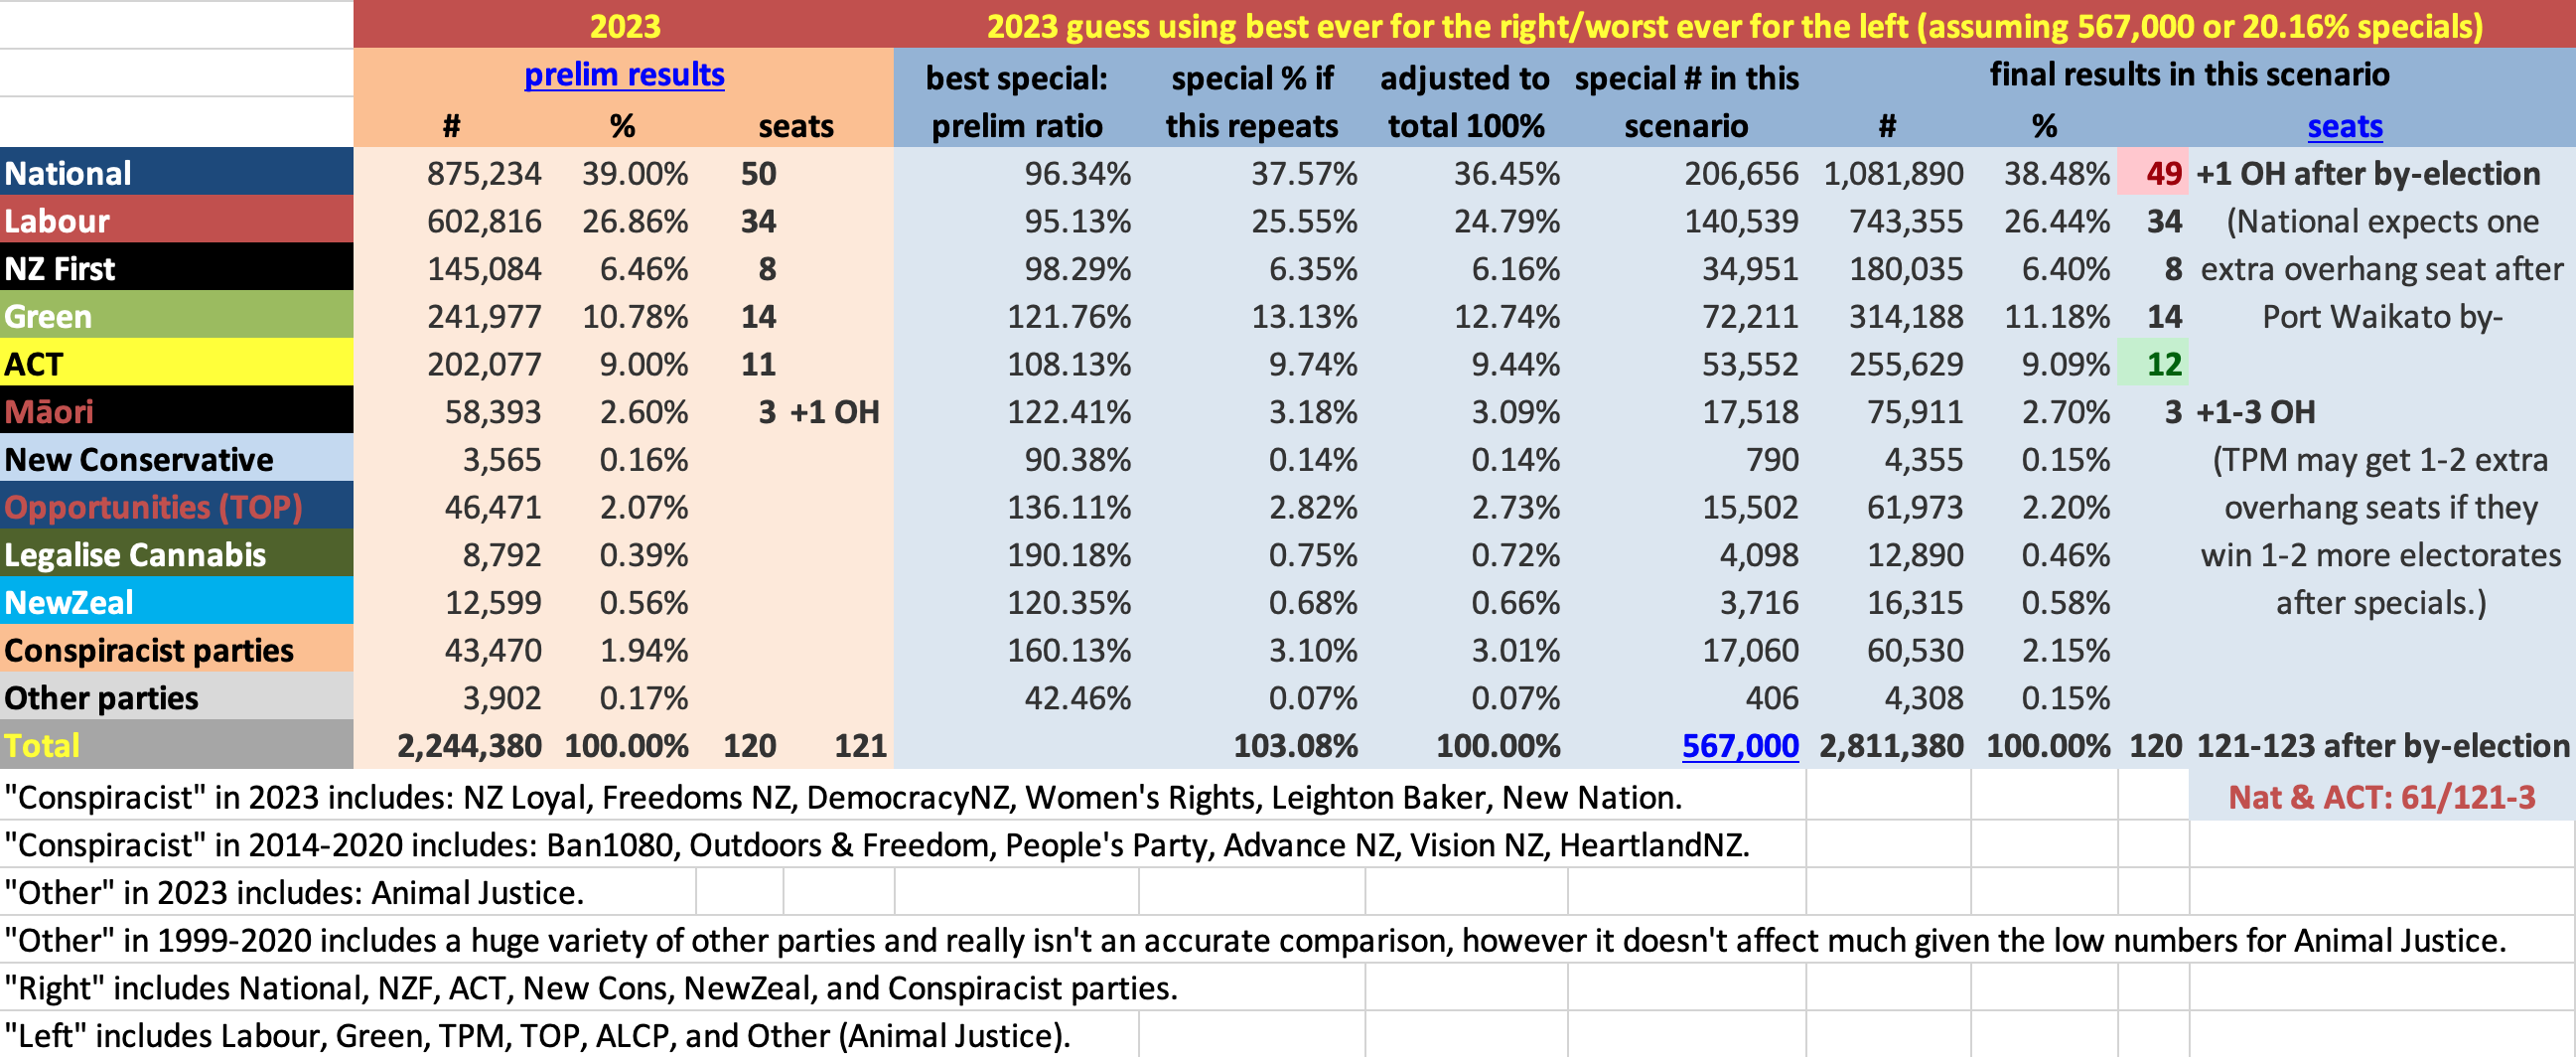
In the next two analyses I compared “best ever” for one side of the political spectrum and “worst ever” for the other side. Of course, my categorisations of “left” and “right” might be contestable. Also, this shouldn’t necessarily be seen as “best possible special votes for the right” etc, because obviously the best outcome for National and ACT would be for their fellow right-wing party NZ First to fall below 5%.
These scenarios don’t require that much adjustment, at least compared to the last set, because it’s built in that there is a balance of good and bad special performances.
These (adjusted) numbers are at the more extreme ends of realistic possibility in one direction or another, as you might expect.
The ‘best ever for right/worst ever for left’ has National only losing one seat and ACT actually gaining one, meaning essentially no change from preliminary results. These are the kinds of results National and ACT will need to be able to survive without Winston First – but as the first table with all special performances shows, neither party has had these kinds of results for many years – especially not with ACT as a more-than-one-person party.
The ‘best ever for left/worst ever for right’, on the other hand, has National losing four seats (two going to Green, one to Labour, and one to TPM i.e. cancelling out that overhang).
I don’t expect either of these scenarios to eventuate but they would still be (sort of) within past precedent.

Two Māori seats: Too close to call
As I keep alluding to, Te Pāti Māori could win some extra electorate seats on specials: Te Tai Tokerau and Tāmaki Makaurau. In these two Māori electorates, the TPM candidate is only about 500 votes behind the Labour candidate, and since TPM do better than Labour on specials, they could catch up.
I have done a quick analysis of the Te Tai Tokerau to see how likely this is. I didn’t do Tāmaki Makaurau because I couldn’t find the preliminary results from previous elections anywhere. (Edgeler uses the final count of advance + on the day votes, but that is not actually the same as preliminary votes.) I found the Te Tai Tokerau preliminary results from previous elections on the Northern Advocate website so here we go.
This is a lot less reliable than the nationwide party vote analysis because the numbers are a lot lower and the parties don’t all run every time. Also, TPM are a different party now than they were a few years ago, so their voter patterns might have changed. I haven’t gone back any further than 2017, largely because of the changing landscape of kaupapa Māori parties.
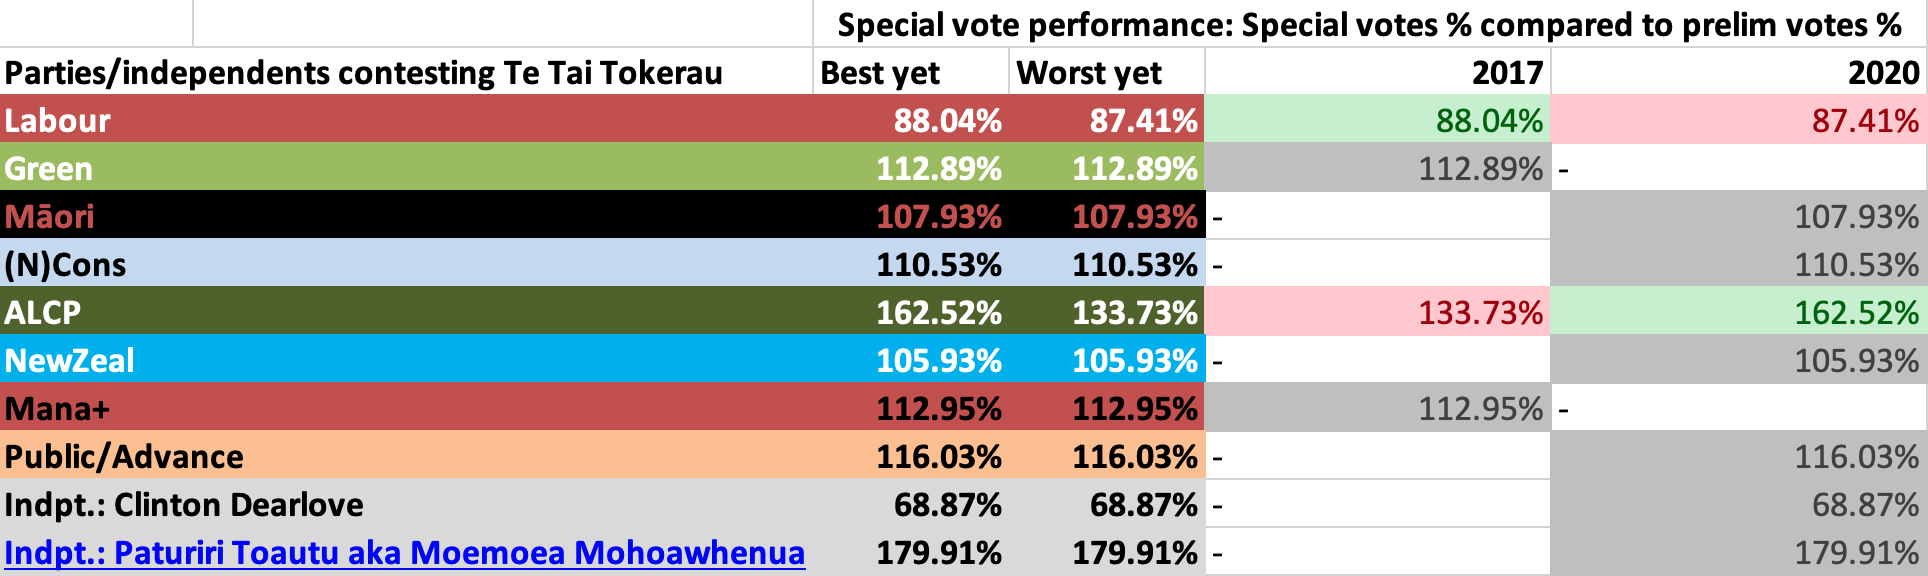
But even going back to 2017 reflects influence of this changing landscape: as you will see from the above table, actually in 2017 TPM didn’t run a candidate in Te Tai Tokerau; they implicitly endorsed Hone Harawira of Mana. Also the Greens didn’t run in 2020. So I’ve had to use the Greens’ 2017 result on the 2020 analysis. I also did two versions of the 2017 analysis: one where I give TPM their candidate’s 2020 result, and one where I give TPM Harawira’s 2017 result.
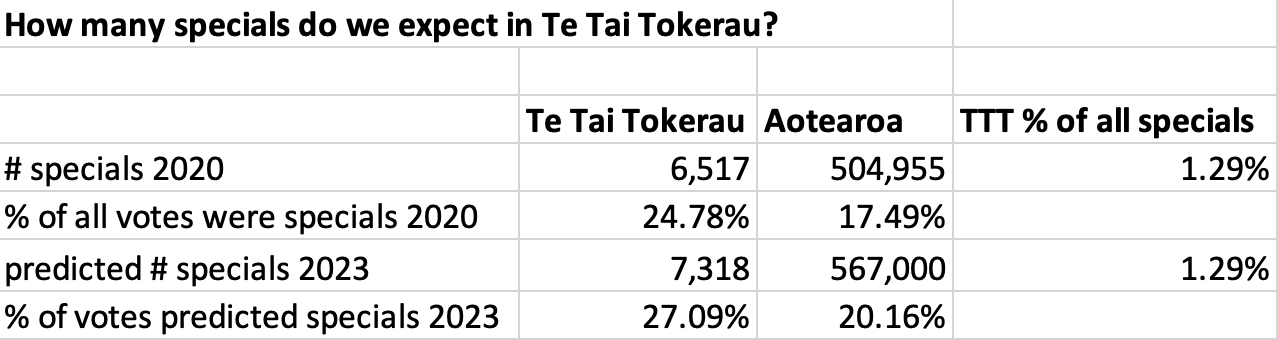
Oh, and I’ve also guesstimated that 1.29% of specials will be cast in Te Tai Tokerau (i.e. a 1.29% estimate of 567,000, which is itself also only an estimate), as this was the case in 2020. So there’s a whole lot of guesswork and approximations and proxies going on.
Anyway, FWIW, here are what the numbers tell us: If 2020 patterns hold, Labour’s Kelvin Davis will just hold onto the seat but the margin will narrow to about 100 votes. If 2017 patterns hold (but using TPM’s 2020 result in lieu of a 2017 result), ditto. But if 2017 patterns hold (but this time using Mana’s 2017 result in lieu of a TPM 2017 result), TPM’s Mariameno Kapa-Kingi will win the seat by the narrowest of margins.
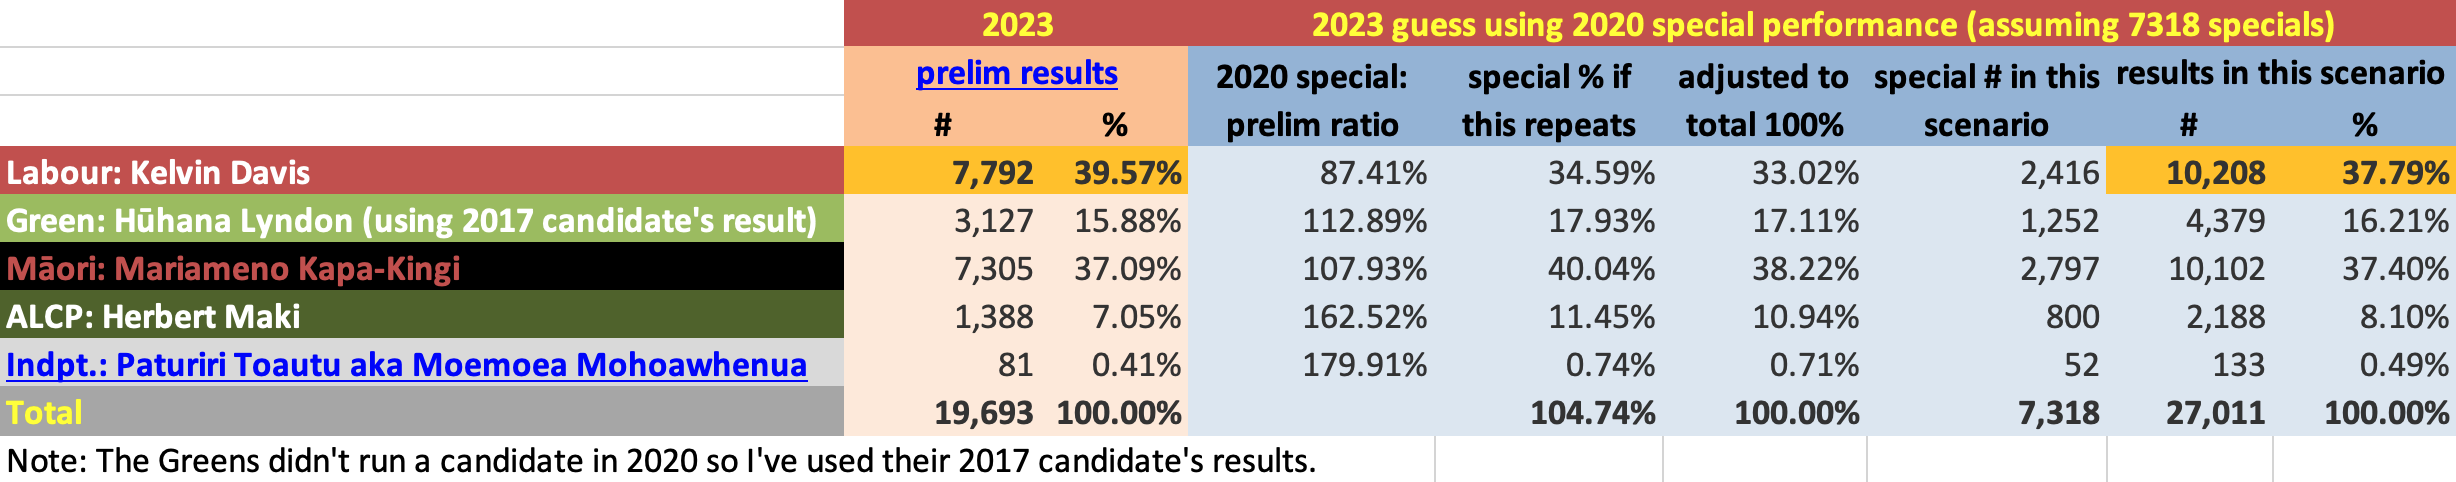
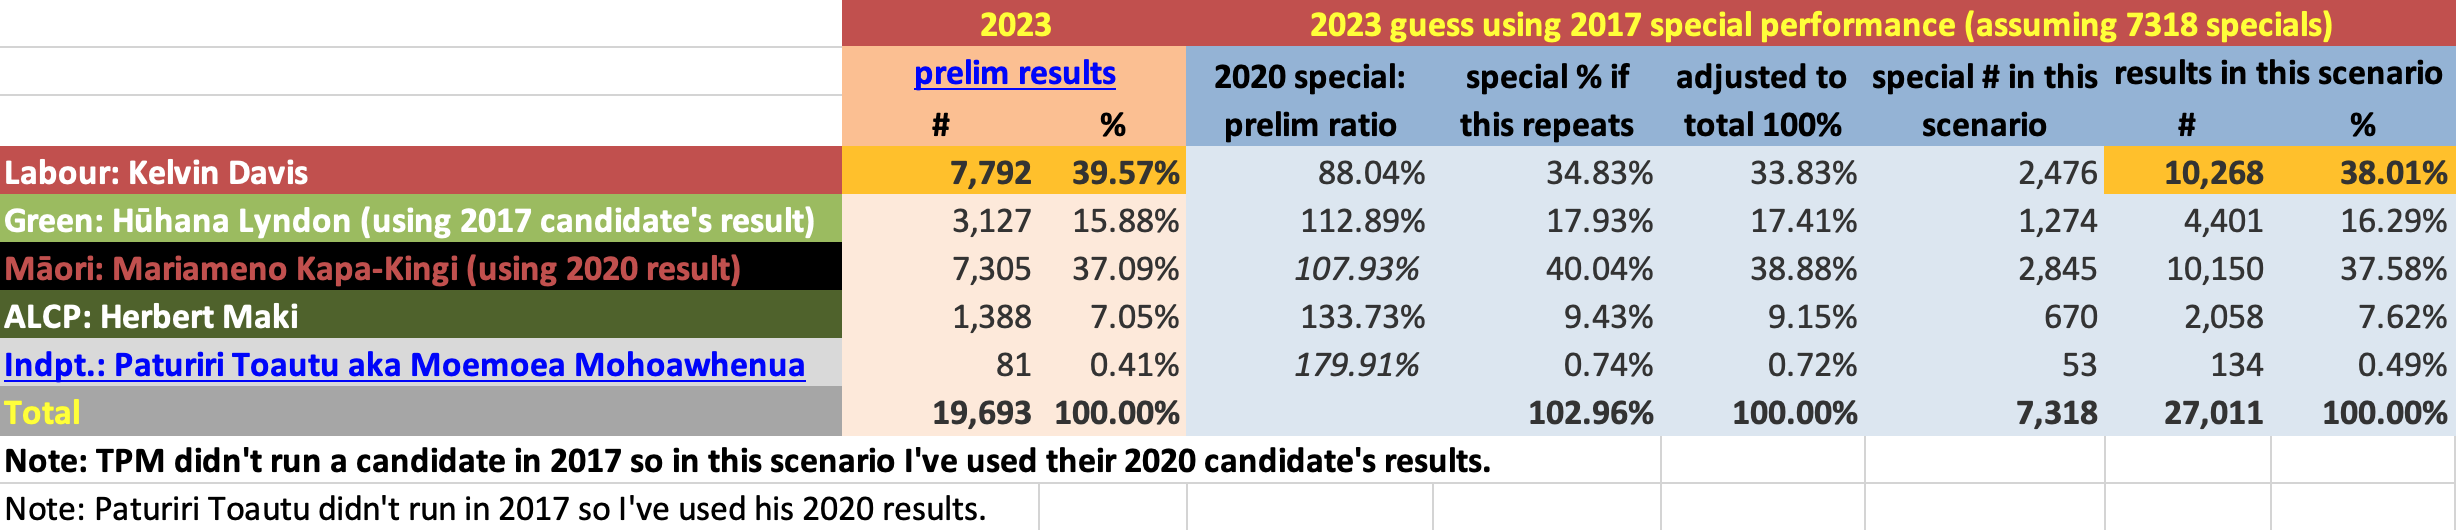
Basically: it’s too close to call. And I expect the same is true in Tāmaki Makaurau. TPM could win one eat, both, or neither on specials, and none of those outcomes would be surprising. The only real surprise would be if either seat is not close.
Other electorates
The other 5 Māori seats are not close. The results won’t change.
I haven’t bothered to look at the close general electorates to see how likely they are to flip.* My suspicion without data is that one or two will flip National to Labour. Changed results in general electorates might change which individuals are heading to Parliament, but it won’t change the overall numbers, as no party has a chance of winning an electorate that isn’t already guaranteed representation through other electorates and/or the 5% threshold. TOP’s Raf Manji, for example, is well behind National’s Hamish Campbell in Ilam. Based on these two parties’ past performance on specials, I expect Manji will narrow the gap, but nowhere near enough. Also, no party other than TPM is gonna get overhang seats (weirdly National is closest to getting overhang seats, because they’re winning 45 electorates on prelims, and they’ll only get 47 on 48 – at a push, 46 or 49 – on party vote entitlement. But the 45 number is not going to go up, and their party vote seat entitlement won’t go below 45).
* Edit on the morning before special votes are announced: According to the Spinoff’s daily Bulletin email, “Ones to watch include Nelson, where Labour’s Rachel Boyack currently trails National’s Blair Cameron by just 54 votes; Mount Albert, where Labour’s Helen White leads National’s Melissa Lee by 106 votes; Banks Peninsula, where National newcomer Vanessa Weenink is 83 votes ahead of Labour MP Tracey McLellan; New Lynn, and Te Atatū, where National newbie Angee Nicholas leads veteran Labour MP Phil Twyford by a stunningly tight 30 votes.” I’m gonna go ahead and guess Labour wins all four of those.
Quick blog on how National sees its Asian MPs

Bridges responds with “Which is what we’ve got at the moment, right?” before going on to insult some of his pākehā MPs. (Image from The Spinoff)
I recommend this Spinoff article about National leader Simon Bridges’s and former protege Jami-Lee Ross’s conversation about the relative merits of different Asian ethnicities on the National candidates’ list. (The full conversation, recently leaked by Ross, is here.)
I have often noticed that Labour and the Greens are bad at putting forward elected representatives of Asian, especially Chinese descent. National have put forward more Asian and Chinese MPs, and I thought this was to their credit. However, this conversation gives insight into the ugly motivations behind National’s ethnic inclusion.
The starkest and most widely-quoted comment, “two Chinese would be more valuable than two Indians”, was made by Ross, who could be seen to have been deliberately goading Bridges to sound bad on a secret recording.
However, Bridges is far from off the hook—fact I’d say he’s more guilty than Ross of the cynical racist way of using rather than representing Asian communities. The topic of relative value of ethnicities was brought up in the conversation by Bridges, who said it “depends where we’re polling” as to whether they should have “Two Chinese” or “One Chinese [and] one Filipino”. The implication is that the only reason to have non-white people in the caucus is to win votes from those communities. Ross’s comment was a reflection and expansion of Bridges’ point. Also, Bridges agreed with Ross’s stark comment by offering a reflection and expansion of his own (rather than stepping in as a leader to correct Ross for expressing the issue in terms of relative value). Perhaps worst of all, Bridges also immediately thought of the two current Indian National MPs, saying “which is what we’ve got at the moment, right?”. This reveals that he thinks in these ways about his existing MPs, not just about hypothetical future MPs during a conversation about strategic nomination decisions to get ethnic communities on board.
I don’t fully know how to feel so here’s some graphs
The day after the election I said “I’d be extremely surprised if it doesn’t turn out to be National-NZ First.” Well, I have the pleasure (I think?) of being able to say again: I was wrong.
I’m not entirely sure how I feel yet.
(I guess I’m happy? We’ll have to wait and see the content of the agreement and what the govt actually does. I hope the Greens demanded a lot and got it (this looks promising but we don’t have details or confirmation yet), and that Winston emphasised the 1/3 of him that’s like Sanders rather than the 2/3 of him that’s like Trump. There is real hope of climate action, more paid parental leave, faster minimum wage increases, reversal of the step-backwards pay equity law, adequate funding for health especially mental health, more support for students and some free education, repeal of national standards and charter schools, more affordable housing even if limited crackdown on speculation, adequately funding a full superannuation system in the future with the taxes future retirees are paying now, less poverty in families where adults are in paid work, and maybe even some benefit rises/humanisation.)
So instead of reactions or analysis I thought I’d do what I do best and make a couple of graphs.
Here’s the first one. It compares the votes received by the parties that ended up making up the government with the votes received by other parties who (a) managed to make it into Government and (b) plausibly might have banded together to form a government.1

The takeaway from this is:
- The 2017 government represents a majority of votes as well as a majority of seats. Under FPP, the government hadn’t represented the majority of votes since 1951. And even under MMP, governments don’t represent a majority of party votes every time (five times out of eight so far).
- The alternative bloc (National & NZ First) would have been an even bigger majority: it got 1.29% more party votes than the bloc that formed the government. But this isn’t new. In 1996, the alternative bloc (Labour & NZ First & Alliance) got 4.42% more party votes than the bloc that formed the government. Both times NZ First chose what they thought was the best government bloc, not the biggest government bloc.
- As I argued in my last blog, MMP creates monarch-maker situations more often than FPP because it more accurately reflects how people vote. As Winston pointed out in his reveal speech, neither National nor the Labour-Green MOU succeeded in winning a majority and king/queenmaking themselves. This left NZF able to make up a majority with either side. A lot of people don’t like kingmakers—especially when they’re people we don’t like, and especially when they don’t choose how we’d like. And I get it. But First Past the Post was worse. It artificially advantaged major parties and leads to disproportionate situations like 1978, 1981, 1984, and 1993 where the opposition bloc won more votes (often substantially more votes) than the government bloc but didn’t get the all-important majority of seats.
Here’s the second graph:

The takeaway from this one is pretty obvious.
Footnotes
- This means I’ve excluded other parties who might have liked to be part of a government bloc but they didn’t make it into Parliament (TOP, Conservatives, Christian Coalition, Legalise Cannabis, Values, sometimes Social Credit, sometimes NZ First, etc.). I’ve also excluded parties where it’s not plausible that they might have worked together: e.g. ACT with National and NZ First this time (they wouldn’t have been needed or wanted). I dunno if it’s plausible that Social Credit might have gone with Labour in 1978 and 1981 and National in 1984 because I don’t really know anything about Social Credit, but I’ve erred on the side of “who knows—maybe”. If we removed Social Credit from the numbers, the opposition blocs would be reduced. But still, in ’78 and ’81, Labour won the popular vote but National won a majority of seats. ↑
Don’t blame MMP for bad king/queenmakers
Where there’s voting, there’s a Deciding Vote
There’s a lot of focus on how much power Winston Peters (i.e. NZ First) currently has in coalition negotiations. He can choose which of Bill English or Jacinda Ardern is Prime Minister, and he’ll probably get some generous policy/baubles concessions from whichever one he chooses.
A lot of people seem to be saying it’s MMP that gives Winston this power. It’s obvious why people would say this: he’s had this power twice in our eight MMP elections, and he never had it under FPP. Still, I don’t think it’s the whole truth.
Rather, I think kingmakers/queenmakers (or, in general, people with a lot of power because they hold a deciding vote) are produced by the practice of making decisions by voting.
For example: in practice, the most contentious legislative matters in the United States of America are currently decided by one person: Supreme Court Associate Justice Anthony Kennedy. He was appointed by Reagan, but he’s more left-leaning than the other four Republican-appointed justices and more right-leaning than the four Democratic-appointed justices. So he’s often the deciding vote when the justices vote along broadly partisan lines. For example, he allowed same-sex marriage to be legalised, and he could also strike down partisan gerrymandering.
Of course, he’s not literally deciding by himself: it takes a majority vote to make a decision. However, where majority rules, whoever finds themselves in the position where they can tip the majority one way or another decides what the majority that rules is.
Of course, voting is not the only way things can be decided. In consensus-based decision-making, decisions are reached in much messier but more democratic and empowering ways. In dictatorship, decisions are made by one person or party, not because they find themselves at the centre of the people’s preferences like Winston or Anthony, but because because they’re in power and people are following them instead of resisting or supplanting them.
But when there’s voting (e.g. the votes that happen in Parliament, as well as the votes for who will be the members of Parliament in the first place), there is what we can call the “deciding vote”. And it’s inevitable that whoever holds the deciding vote has a lot of power: the people on either side of the decision can try to motivate them to vote the way they want. This is especially true when it’s clear who holds the deciding vote and when it’s concentrated in the hands of just one person or party (e.g. Kennedy or NZ First). But even when it’s unclear, parties from either side can still speculate about what the deciding voters are likely to want. This is why political parties try to win the centre over to supporting them.
What determines who has the deciding vote is who has a vote and how they’re willing to use it. Who’s made up their mind to support one side in a vote, who’s made up their mind to support the other side, and who’s undecided. A voter among the undecideds who can make or break a majority with their vote has the deciding vote.
Sometimes the deciding vote is held by just one party/person, and it gives that party/person a lot of power. For example, on the US Supreme Court, if four justices have decided to vote against gerrymandering and four have decided to vote for it, Anthony Kennedy has the deciding vote all by himself. But if four justices have decided to vote against gerrymandering and only one has decided to vote for it,1 the remaining four justices share the deciding vote among themselves: any of them can decide to kill gerrymandering.
The Deciding Vote in government formation: the King/Queenmaker
A “kingmaker”/”queenmaker” is someone who holds the deciding vote on who will be Prime Minister. If we directly elected our Prime Minister/government, the deciding vote would be held by members of the general public. It wouldn’t be clear who held it, and it wouldn’t be concentrated in one person’s/party’s hands.
But in parliamentary systems, we don’t elect a PM/government; we elect a Parliament. The members of Parliament elect a PM/government by voting to support the government in votes of confidence and, usually, supply.
So the deciding, king/queenmaking vote is held by an MP or some MPs. (This is the case in all parliamentary systems, not just MMP systems.)
In a way there’s always a king/queenmaker, because there’s always a deciding vote on who the Prime Minister will be. When one party wins a decisive victory in an election, they win the deciding vote, and they get to king/queenmake their own leader. In 1999 and 2002, Labour won the deciding vote; they got to decide how to make up a majority from among the Alliance, the Greens, and United Future. In 2008 and 2014, National won the deciding vote; they got to choose how to make up a majority from among ACT, United Future, and the Māori party.2
It’s only in close elections where neither the left nor the right wins a decisive victory (and when left and right parties aren’t willing to form a grand coalition) that the parties in the centre become king/queenmakers. They get to decide whether to create a centre-right majority or a centre-left majority. And they get to choose which of the two major parties will lead the government and provide the Prime minister.3 And I think I’m OK with that.
When the king/queenmaker is just one party, it gives that party a lot of power. E.g. NZ First currently, or in 1996.
When it’s a group of parties, the power they have is reduced by being shared and requiring coordinated action. For example, technically United Future, the Māori party, and NZ First were joint kingmakers in 2011: if all three had joined Labour and the Greens they could have made Phil Goff Prime Minister with a one-seat majority. But they weren’t willing to do that. Instead, two of them kingmade John Key.
Similarly, Winston is often referred to as the kingmaker in 2005, but technically to kingmake Don Brash, he would have had to bring the Māori party on board too. And that was not going to happen.

Why is NZ First currently the king/queenmaker?
Currently NZ First is the sole king/queenmaker. This is because of which parties won seats and who they’re willing to support in government. There are essentially only four parties, and three have essentially made up their minds which way to vote about who the Prime Minister should be. So that leaves the fourth party with a monopoly on the deciding vote.
It doesn’t have to be this way. Germany (whom we copied MMP from) also recently had an election, but they had six4 parties cross the line. If NZ had more parties represented in Parliament, the kingmaking power would be shared amongst various parties (e.g. TOP, Māori, or even the Conservatives might have been able to make or break governments). This is one reason I support eradicating the undemocratic 5% threshold. When the left, the right, and the centre are all dominated by one party each, those three are more likely to find themselves the sole king/queenmakers.
Germany also have more of a tradition of parties being willing to form coalitions across the left-right spectrum. Until this year’s election, Germany was governed by a grand coalition between their equivalents of National and Labour. But their equivalent of Labour have pulled their support. So now it looks like they’re going to have something roughly equivalent to a National-Conservative-UF-ACT-Green coalition to keep the Alternative for Germany (the closest thing to the Nazis in Germany since the Nazis) out of power.
If a “Teal Deal” was a real option in NZ, the deciding vote would be shared by NZ First and the Greens: Either of them could kingmake Bill English, or they could decide together to queenmake Jacinda Ardern. However, a Teal Deal isn’t a real option in NZ right now—for very good reasons. So NZ First are left as the sole king/queenmaker. (This is presumably why National supporters want to promote the possibility of a Teal Deal: to weaken Winston’s power, as well as Labour’s).
When a party with 0.22% of party votes was the kingmaker and nobody seemed to mind
It’s not often noted in these discussions, but actually even before this election, a minor party held the deciding vote. Moreover, it was a tiny party with only one MP (and 0.22% of the party vote at the previous election): United Future, aka Peter Dunne.
After National lost the Northland seat to Winston Peters in the 2015 by-election, National lost the deciding vote to Dunne.5 In practice, Dunne usually used his deciding vote to support the National-dominated government. However, on some matters he sided with the parties to his left. For example, he (and all other parties except National and ACT) supported Sue Moroney’s bill to extend paid parental leave to 26 weeks. Dunne’s vote was the 61st vote that allowed the bill to pass its second reading. However, then-Finance Minister Bill English implemented a financial veto to stop the bill becoming law. This means Dunne and the Māori Party effectively voted both for and against this bill: while voting for the bill, they were also voting to support the National government in confidence votes, and therefore allowing National its financial veto power.
When this power is a problem, and how it can be addressed
People generally don’t like it when the king/queenmaker is a small party (especially a small party they don’t like); they prefer it when it’s a big party (preferably the big party they like).
People rightly observe that the power of the deciding vote is disproportional to the level of support voters gave that party (whether it’s NZ First’s 186,706 party votes or Peter Dunne’s 5,286 party votes + 13,569 local votes).
This sometimes makes people dislike MMP itself. As I hope I’ve established by now, the deciding vote is not created by MMP: it’s created by the act of voting and distributed by particular voters’ choices. Nonetheless, when New Zealand used First Past the Post instead, we didn’t have this situation. Either National or Labour won the majority of seats every election from 1935 to 1993, even though they rarely won a majority of votes (National only got 35.05% of votes in our last FPP election).
FPP makes it more likely that the deciding vote is held by one of two major parties for one simple reason: because it stacks the deck in favour of major parties. FPP makes it very hard for smaller parties to gain representation: the only way is to earn pluralities of support in certain local constituencies (e.g. the Scottish National Party in most of Scotland, or Rātana in the Māori seats, until they joined Labour).
FPP still doesn’t make small-party king/queenmakers impossible. In Australia in 2010, Labor and the Liberal-National Coalition won 72 seats apiece, and the sole Green MP plus three independents queenmade Labor’s Julia Gillard.6 The same year in the UK, the Liberal Democrats were (technically) kingmakers, because if they’d banded together with some of the tiny parties, they could have kingmade Labour’s Gordon Brown. In 2017, the conservative Northern Irish party the Democratic Unionist Party (1.5% of seats, 0.9% of votes) queenmade Theresa May. They wouldn’t have kingmade Jeremy Corbyn, but nobody else was going to queenmake May, so if the DUP had refused also, a fresh election would have been required. Thus, they had a lot of leverage and won a lot of concessions from the Tories.
Moreover, FPP has other problems that, to my mind, outweigh the greater risk of a small party exercising disproportionate power when it finds itself with the deciding vote. Here are three pretty major problems:
- Under FPP, the party that wins the most votes doesn’t necessarily win the most seats. Labour got more votes than National in 1978 and 1981, but Robert Muldoon got to remain PM because National had a majority of seats. Similarly in the USA (where the electoral college votes work like Parliamentary seats in voting for the executive), the popular vote winner often doesn’t win: this is what gave George W. Bush and Donald Trump the presidency. Small parties may produce king/queenmakers we don’t like, but big parties produce PMs and presidents we don’t like, even when they only get a minority of votes.
- Under FPP, parties often receive a large proportion of votes, but few if any seats in Parliament. Again in 1978 and 1981, Social Credit won 16.1% and 20.7% of votes, but they only got one and two seats. In 1993, the Alliance got 18.21% of votes and only two seats. Similarly in Australia, for the last three elections their Green Party has got about 10% of votes but only one seat.6
- Under FPP, “swing states” or “swing electorates” often receive the vast majority of the attention and policy promises. This is most obvious in the US: in last year’s presidential election, 12 states received almost all the advertising and visits from candidates. The disproportionate power centrist constituencies hold is similar to the disproportionate power centrist parties receive when they find themselves with the deciding vote.
So solving the “Winston too likely to become kingmaker” problem by going back to FPP is undesirable for other reasons.
I would rather address the problem with an approach that’s desirable for other reasons: making MMP more genuinely proportional and democratic. We should eradicate the 5% threshold that lets National, Labour, and NZ First dominate the right, the left, and the centre. We should also introduce elements of preferential voting. Electorate votes should be selected by a Single Transferrable Vote, like city councillors are. And if we insist on keeping a party vote threshold, we should allow people to name a second choice, so if their first choice doesn’t make the cut, their vote won’t be wasted. These changes would make it more likely that NZ First would have to share the deciding vote with other parties in the centre. They would also make it easier for major parties to win the centre and the deciding vote, by giving them more support parties at the far ends of the political spectrum.
I’ve previously suggested that the Opportunities Party should devote their considerable resources to making MMP more democratic in these ways. Their dislike of Winston Peters and desire to strip him of his “monarch maker” powers is yet another reason for them to do so.
Footnotes
- Gorsuch, I assume, cos he’s a dick. Though, to be fair, he’s not the worst. ↑
- Shrewdly, they chose all three even though they only needed one or two, to ensure none of the three had too much power. If they’d just chosen ACT, that would have been enough for a majority, but if ACT ever considered voting against National, the deciding vote would have flipped into ACT’s hands. With three small support parties, all three of them would have had to decide to vote against National in order to seize the deciding vote. ↑
- Technically, it’s not impossible for a junior coalition partner to provide the Prime Minister. This happened in NZ in 1931: the third-biggest party, United, provided the Prime Minister, George Forbes, in their coalition government with the second-biggest party, Reform. This is a very different situation to our current Parliament, because United and Reform ran as a coalition (and eventually merged to form the National party). However, the United-Reform coalition was formed precisely because United, the kingmakers, broke away from Labour and united with Reform. In both governments, United kingmade their own leader as Prime Minister. Anyway, I’d be astonished if Winston will become PM in this case, despite what David Seymour might say. If either National or Labour/Green gave him the top job, the voters would severely punish them in three years. ↑
- Technically seven, but the Christian Democratic Union and the Christian Social Union of Bavaria are basically one party. ↑
- Technically Dunne shared the deciding vote with any other party willing to vote with National/ACT. But on questions where Dunne voted against National/ACT, it would have been unusual for Māori or NZ First to vote with them to give them a majority. I don’t know of any votes where this happened. ↑
- Australia doesn’t actually have FPP, but it does have single-seat constituencies in its lower house. They’re distributed via Single Transferrable Voting in each constituency. They almost always go to a candidate from either Labor or the Liberal/National coalition. STV doesn’t really help Green candidates get in, but it does ensure Green votes are redistributed to voters’ second choice (usually Labor candidates, it seems) instead of splitting the left vote and letting the Coalition win every time. ↑
